
Figures & data
Table 1. Territorial development indicators.
Table 2. Descriptive statistics.
Figure 1. Dendrogram based on all variables.
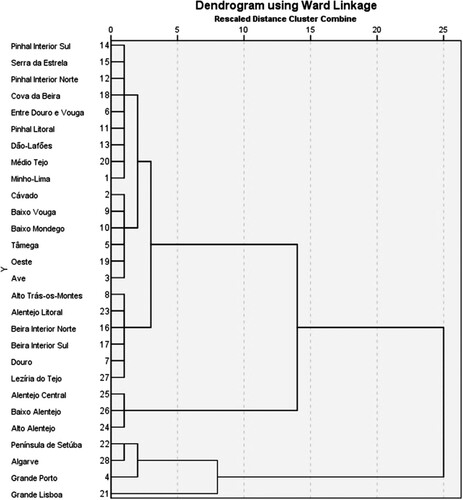
Figure 2. Clusters of Portuguese regions.
Note: These groups of regions show the results for the index with three dimensions as well as environmental quality.
Source: Authors’ elaboration.
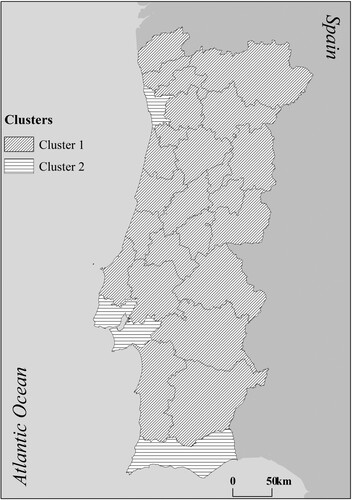
Table 3. Averages of discriminant analysis.
Table 4. Tests of equality of group means.
Figure 3. Dendrogram analysis based on competitiveness variables.
Source: Authors’ elaboration.
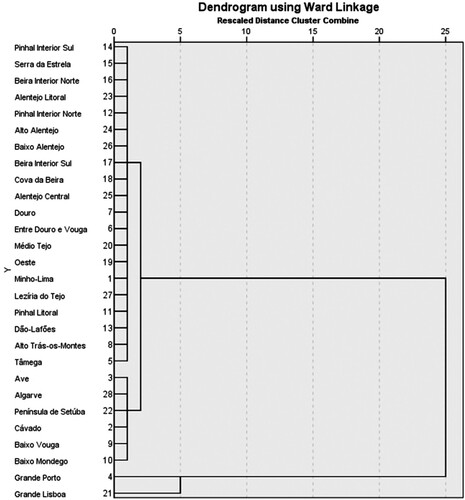
Figure 4. Clusters of Portuguese regions based on the competitiveness dimension.
Note: These groups of regions show the results for the competitiveness dimension as well as the cohesion dimension.
Source: Authors’ elaboration.
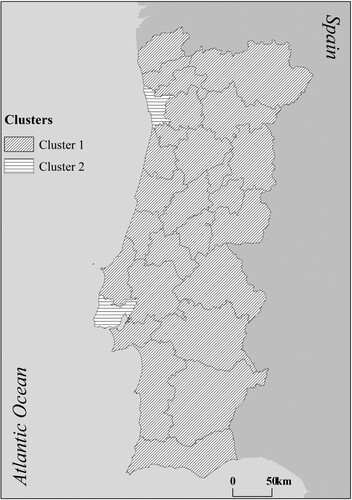
Table 5. Averages of discriminant analysis based on competitiveness variables.
Table 6. Tests of equality of group means based on competitiveness clusters.
Figure 5. Dendrogram analysis based on cohesion variables.
Source: Authors’ elaboration.
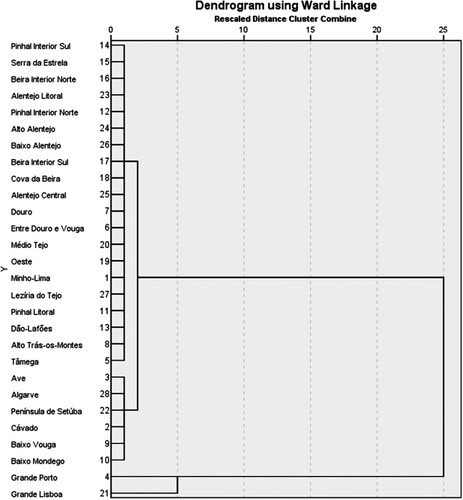
Table 7. Averages of discriminant analysis based on cohesion variables.
Table 8. Tests of equality of group means based on cohesion clusters.
Figure 6. Dendrogram analysis based on environmental quality variables.
Source: Authors’ elaboration.
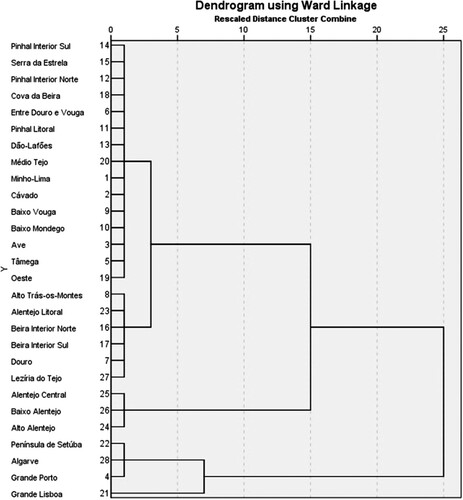
Table 9. Averages of discriminant analysis based on environmental quality variables.
Table 10. Tests of equality of group means based on environmental quality variables.
Table A1. Cluster membership.
Table A2. Standardized canonical discriminant function coefficients.
Table A3. Standardized canonical discriminant function coefficients based on competitiveness variables.
Table A4. Standardized canonical discriminant function coefficients based on cohesion variables.
Table A5. Standardized canonical discriminant function coefficients based on environmental variables.