
Figures & data
Figure 1. The Kuznets process.
Source: Anand and Kanbur (Citation1993).
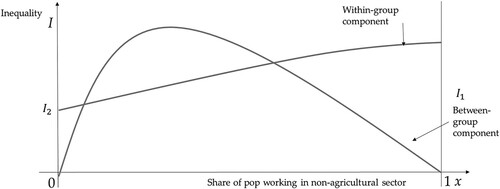
Figure 2. (a) Percentage of agriculture, industry and services in value added; and (b) percentage of employment in agriculture, industry and services in Indonesia.
Source: Groningen Growth and Development Centre (GGDC) 10-Sector database.
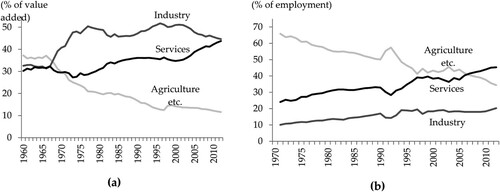
Figure 3. Income per capita and inequality of Indonesian district versus countries, 2015.
Sources: Authors’ estimates, UNU-WIDER, World Income Inequality Database (WIID3.4) and World Bank (Citation2019).
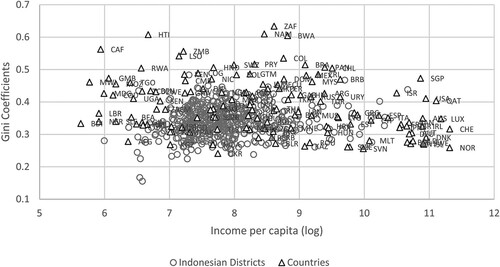
Figure 4. Density curve of consumption per capita by sector of the economy.
Note: The horizontal axis is the log of expenditure per capita per month: (a) agriculture; (b) non-manufacturing industry; (c) manufacturing; (d) trade and transportation; (e) finance; and (f) non-market services.
Source: Authors’ estimates.
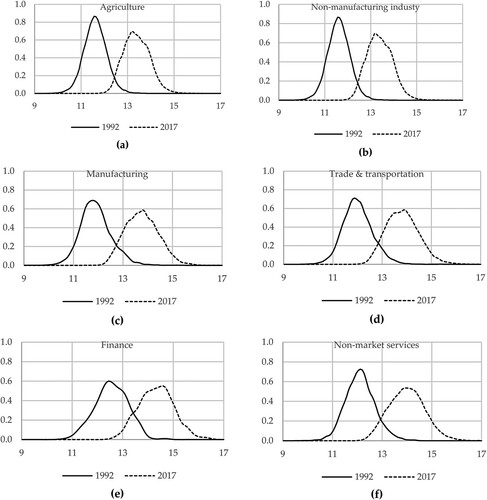
Figure 5. Atkinson index of inequality in various sectors, and within- and between-sector components, 1992–2017.
Note: (a) Atkinson index with ϵ = 0; and (b) Atkinson index with ϵ = 1.
Source: Authors’ estimates.
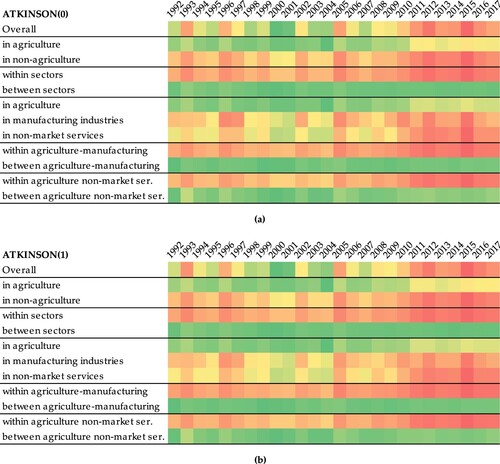
Figure 6. Relationship between sectoral employment share and inequality, 1992–97, 2000–17 and 1992–2017.
Source: Authors’ estimates.
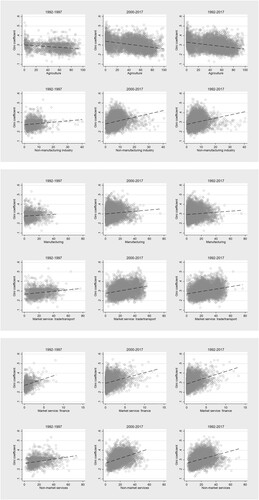
Table 1. Regression results with Gini indicator as a dependent variable, without control variables.
Table 2. Regression results with Gini indicator as dependent variable, with control variables.
Table 3. Regression results with Gini indicator as dependent variable, without control variables.
DATA AVAILABILITY STATEMENT
The data that support the findings of this study are available from Arief Anshory Yusuf upon request.