
Figures & data
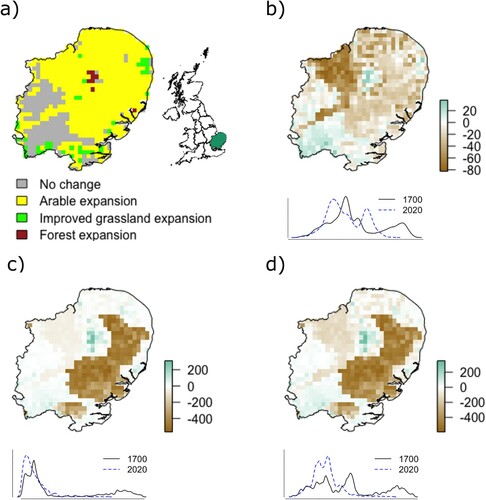
Figure 1. Change in terrestrial organic carbon storage from 1700 to 2020 in the East of England as simulated by the N14CP model.
Note: (a) Land-use change; (b) topsoil carbon change (kt); (c) vegetation carbon change (kt); and (d) total terrestrial organic carbon change (kt). Line graphs show the distribution of data for 1700 and 2020.
Supplemental material