
Figures & data
Figure 1. Simple graphical representation of the demand threshold framework.
Source: Authors, drawing on Christaller’s (Citation1966) classic work.
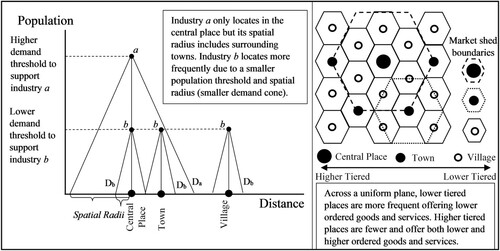
Figure 2. Simple graphical representation of random profit maximization.
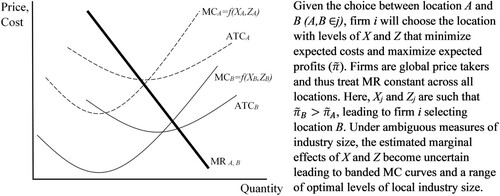
Figure 3. Business location modeling decision tree.
Note: This figure visualizes the interaction between data types and the associated feasible model types. For more detailed discussion of the additional interaction and overlay of the potential for spatial models/effects, see . ADV, advantage; and IIA, independence of irrelevant alternatives.
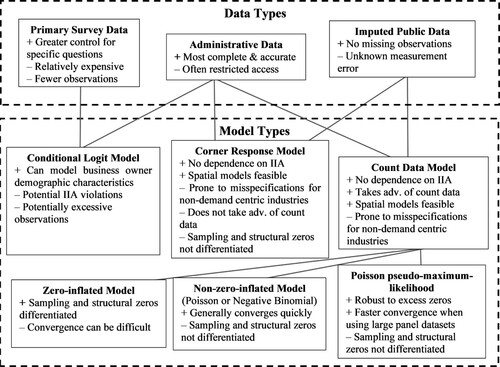
Table 1. Aspatial estimators in business locational determinant research.
Table 2. Spatial estimators in demand threshold and business locational research.
Supplemental material
