Figures & data
Figure 1. Daily positive cases for Covid-19 in the United States, 23 January 2020–20 January 2022.
Source: Author from Centers for Disease Control and Prevention (CDC) data, https://data.cdc.gov/Case-Surveillance/United-States-COVID-19-Cases-and-Deaths-by-State-o/9mfq-cb36/data
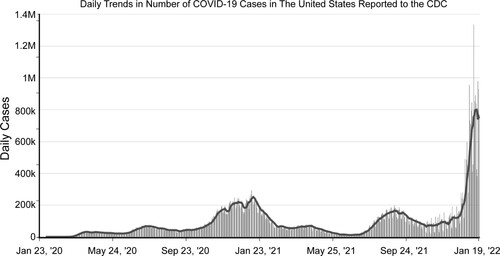
Figure 2. Vaccination rates (percentage of 12+ population) by state (and other units) across the United States as of 20 January 2022.
Source: Author from Centers for Disease Control and Prevention (CDC) data, https://www.cdc.gov/coronavirus/2019-ncov/vaccines/reporting-vaccinations.html
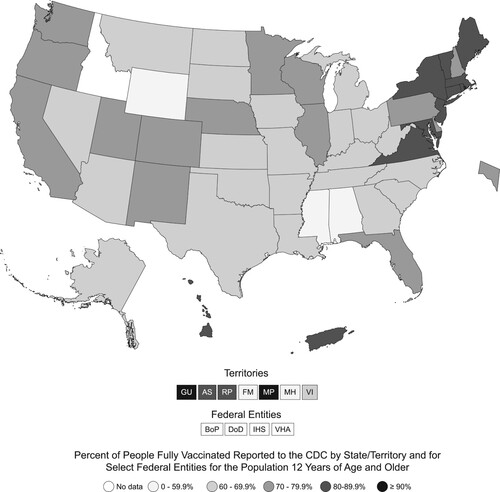
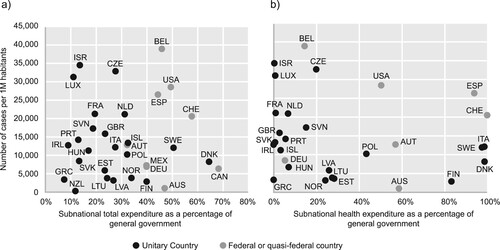
Figure 3. Federal versus unitary systems in expenditure patterns and Covid-19 cumulative cases (OECD member countries), January–December 2020: (a) cumulative cases versus total subnational expenditures; and (b) cumulative cases versus subnational health expenditures.
Source: Redrawn from De Biase and Dougherty (Citation2021).