Figures & data
Table 1. Employment and unemployment shares, by federal state.
Table 2. Employment and unemployment, by skill category.
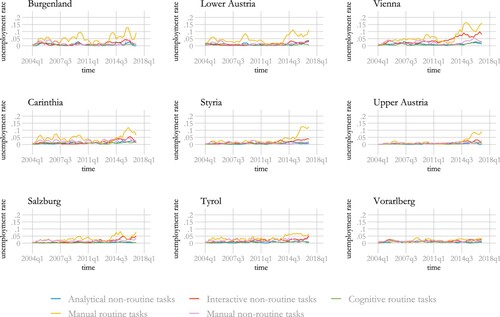
Figure 1. Unemployment rates and vacancy rates, by region.
Note: Quarterly data, 2004–16.
Source: Statistik Austria (Citation2020).
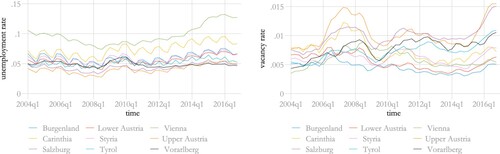
Figure 2. Unemployment rates and vacancy rates, by skill category.
Note: Quarterly data, 2004–16.
Source: Statistik Austria (Citation2020).
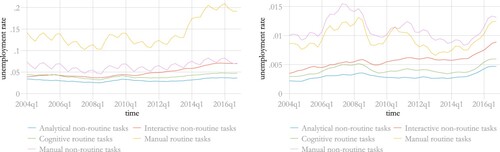
Figure 3. Transition rates between labour market statuses, Austria, 2004–16.
Note: Calculations are based on quarterly data from 2004 to 2016.
Source: Statistik Austria (Citation2020).
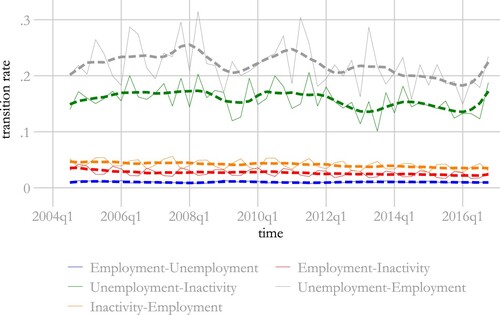
Figure 4. Job-finding rates, by region and skill category.
Note: Calculations are based on quarterly data from 2004 to 2016. ISCO-08 occupations are grouped as manual routine tasks, manual non-routine tasks, analytical non-routine tasks, interactive non-routine task and cognitive routine tasks (see Table B4 in Appendix B in the supplemental data online for details).
Source: Statistik Austria (Citation2020).
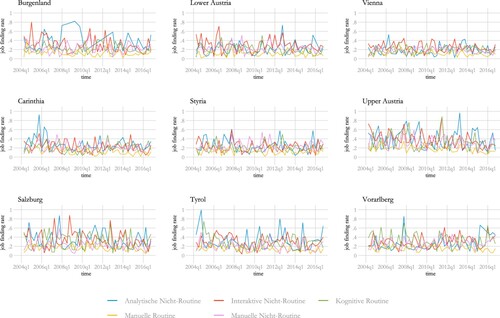
Figure 5. Mismatch indicator and Beveridge curves, aggregated data for Austria, 2004–16.
Note: The trend was obtained by local linear smoothing. The hypothetical Beveridge curves are estimated with the average matching efficiency before 2014 and after 2014.
Sources: Calculations based on data from Statistik Austria (Citation2020); and AMS Österreich (Citation2020).
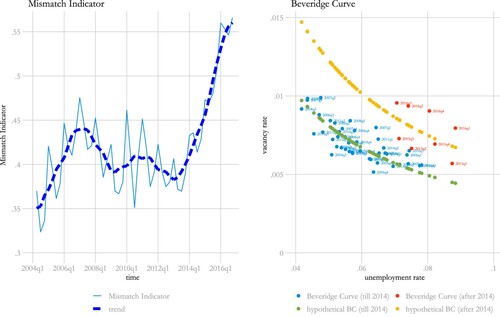
Figure 6. Mismatch unemployment, aggregated data for Austria, 2004–16.
Note: Mismatch unemployment is the difference between the unemployment rate under a stable matching productivity and the steady-state unemployment rate.
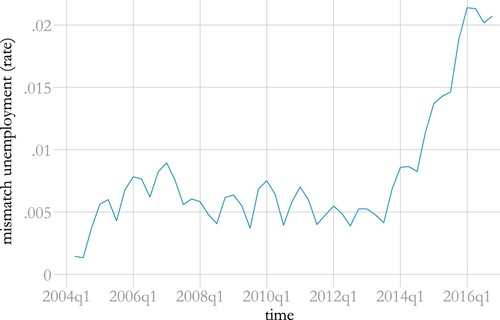
Figure 7. Mismatch unemployment, by region.
Note: Mismatch unemployment is the difference between the unemployment rate under a stable matching productivity and the steady-state unemployment rate.
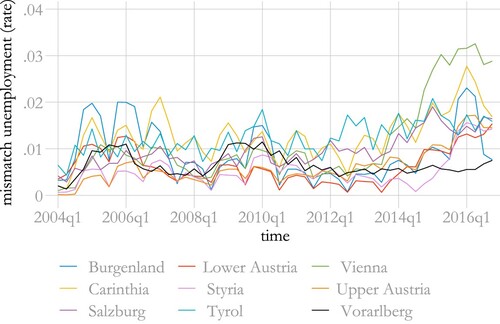
Figure 8. Mismatch unemployment, by skill level.
Note: Mismatch unemployment is the difference between the unemployment rate under a stable matching productivity and the steady-state unemployment rate.
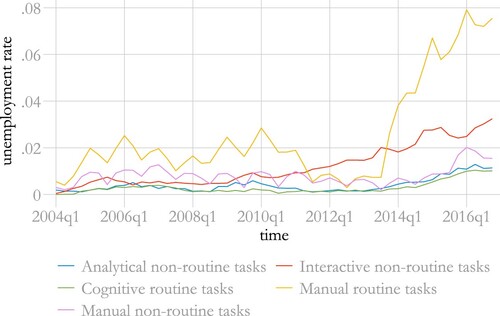
Figure 9. Mismatch unemployment, by region and skill level.
Note: Mismatch unemployment is the difference between the unemployment rate under a stable matching productivity and the steady-state unemployment rate.