
Figures & data
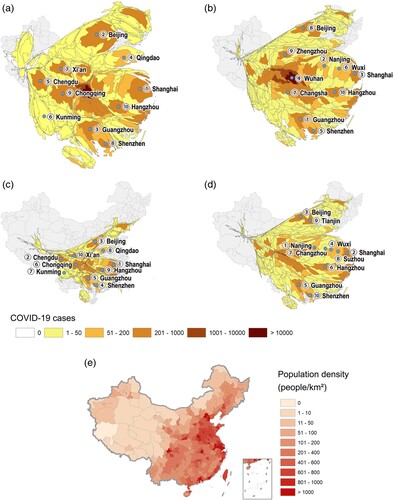
Figure 1. Cartogram of intercity transportation networks: (a) Air network before Covid-19 (14 February 2019); (b) the HSR network before Covid-19 (2019); (c) the air network during Covid-19 (14 February 2020); (d) the HSR network during Covid-19 (14 February 2020); and (e) population density.
Note: The number of flights from/to cities (a, c) and the daily average number of high-speed trains (HSTs) in 2019 (b, d) are shown. The top 10 cities are labelled by flights/HSTs. Cumulative confirmed Covid-19 cases denote those between 31 December 2019 and 14 February 2020. The population density in 2019 is displayed in (e).
Supplemental material