
Figures & data
Figure 1. Digital firm birth in regions.
Note: Pooled for all years available in the sample (1995–2017).
Source base map: GeoBasis-DE/BKG 2021.
Map of the share of firm birth in the regions, with representation of the relation of the firm birth in the city cores and the surrounding municipalities, showing that most of the firm birth is taking place in the urban cores.
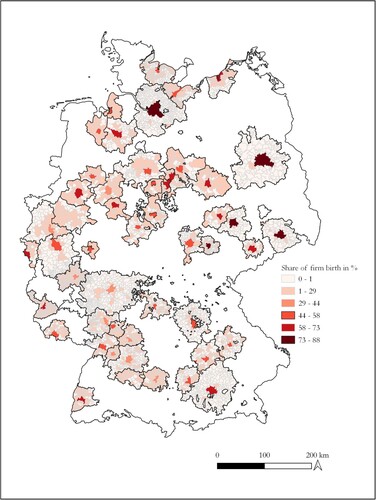
Table 1. Absolute firm birth in centres and municipalities.
Table 2. Share of firm birth in regions including centres.
Table 3. Estimation results of baseline regressions.
Figure 2. Post-estimation interaction plot for monocentric urban regions (MURs).
Note: Quintiles 3 and 4 are insignificant in the estimation results.
A line graph with five lines each presenting one distance quintile from monocentric labour market regions. The Graph shows five descending lines in different slopes, with the share of firm birth in the municipalities on the y-axis and the share of firm birth in the next center on the x-axis.
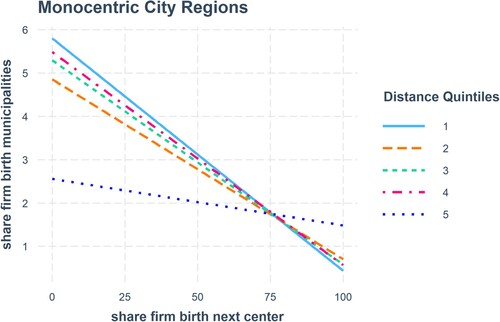
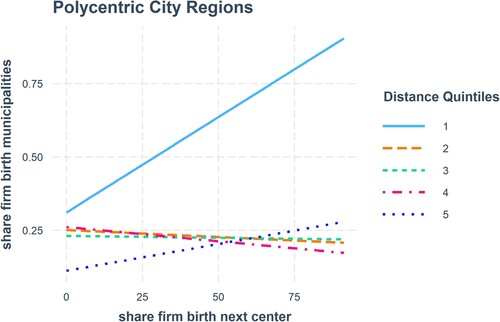
Figure 3. Post-estimation interaction plot for polycentric urban regions (PURs).
Note: All coefficients are significant in the estimation.
A line graph with five lines each presenting one distance quintile from polycentric labour market regions. The Graph shows one outstanding first distance quintile with a strong positive slope, Quntiles 2-4 are slightly negative in slope, and the fifth one positive again. The share of firm birth in the municipalities is on the y-axis and the share of firm birth in the next center on the x-axis.
Supplemental material