
Figures & data
Figure 1. Dimensions in spatial structure.
Source: Adapted from Meijers and Burger (Citation2010).
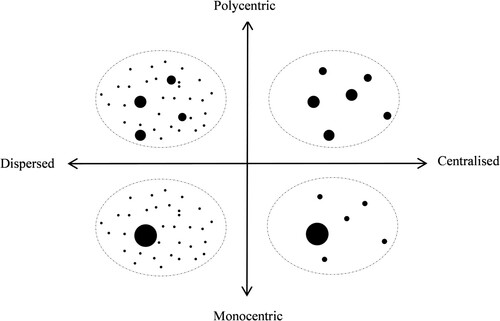
Figure 2. Rank–size distribution for Ninh Thuan (left) and Đăk Nong (right).
Source: Author’s calculations.
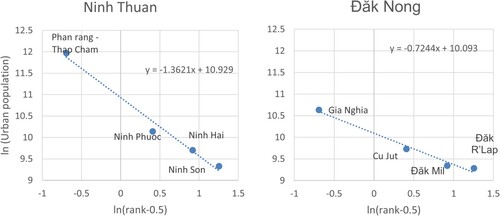
Table 1. Descriptive statistics of variables in models.
Figure 3. Main features of the spatial structure of Vietnam: (a) population distribution, (b) degree of polycentric–monocentric dimension and (c) degree of decentralized–centralized dimension.
Source: Author’s calculations.
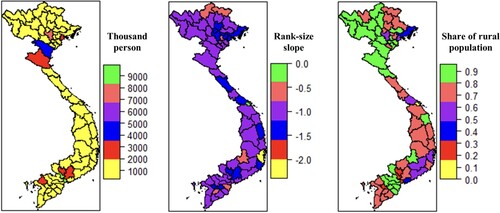
Table 2. Results from ordinary least squares regression (OLS) for the effects of spatial structure on labour income.
Table 3. Results from ordinary least squares regression (OLS) for the effects of interaction between spatial dimensions on labour income.
Table 4. Results from two-stage least squares (TSLS) for the effects of spatial dimensions on labour income.
DATA AVAILABILITY
Data available on request from the authors.