
Figures & data
Figure 1. Spatial distribution of SC (average 2004–2012). Source: Our elaborations on Nifo and Vecchione (Citation2014) data.
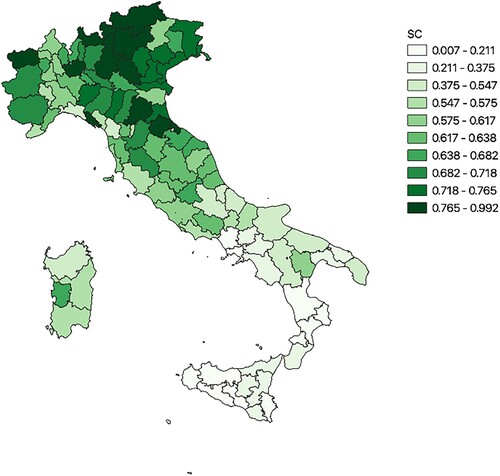
Table 1. Robust system-GMM estimation results.
Supplemental material
Figure 1. Spatial distribution of SC (average 2004–2012). Source: Our elaborations on Nifo and Vecchione (Citation2014) data.
Table 1. Robust system-GMM estimation results.