
Figures & data
Figure 1. Annual changes in lower- and upper- middle-class size. Source: EU-SILC (2004–17) and authors’ own elaboration.
This figure shows the evolution of the lower- and upper-middle class size for each one of the regions in the period 2004–17, where the class size for 2004 is set to 100. Note: class size in 2004 is 100.
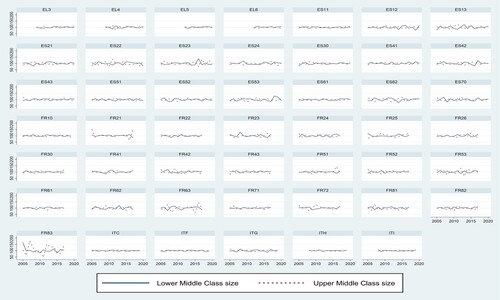
Figure 2. Quartile map of lower- and upper-middle-income class size, 2004 and 2017.
This figure shows four quartile map of income class size in 2004 and 2017 as follows: (1) top left, lower-middle income size in 2004; (2) top right, lower-middle income size in 2017; (3) bottom left, upper-middle income size in 2004; and (4) bottom right, upper-middle income size in 2017.
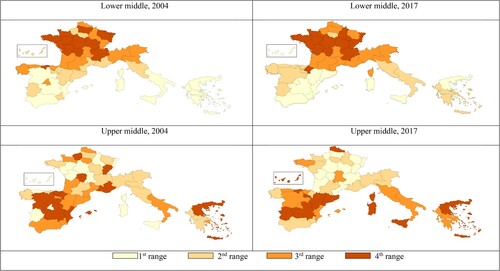
Table 1. Moran’s index test for income classes by population, 2004–17.
Table 2. Conditional convergence model estimation (SDM): decomposition of gross domestic product (GDP) growth rate.
Table 3. Conditional convergence. Estimation of direct and indirect effects.
Supplemental material
Supplemental Material
Download PDF (195.6 KB)DATA AVAILABILITY
This paper used European Union Statistics on Income and Living Conditions (EU-SILC) data, which are public and can be freely accessed by contacting EUROSTAT. However, the authors cannot provide it due to the privacy clause signed in the contract with EUROSTAT.