
Figures & data
Figure 1. Bar chart of propensity scores.
Note: The propensity score represents the probability that each city individual will be affected by the HSR, i.e., the probability of being selected to the treatment group. The vertical axis represents the nuclear density. On support means that samples are successfully matched after the PSM method, i.e., propensity scores of both treatment and control groups are in the range of common support, and off support means that samples are not successfully matched after the PSM method, indicating data of these samples ought to be omitted (Abadie & Imbens, Citation2016).
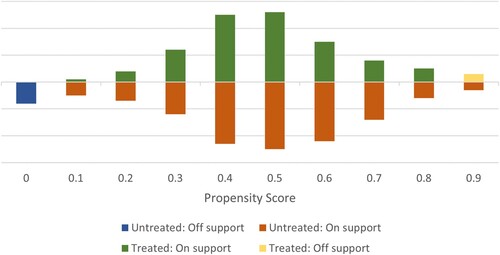
Table 1. Variable definitions of PSM-DID analysis.
Table 2. Balance test results of PSM.
Table 3. Impacts of HSR on fixed and variable costs.
Table 4. Test of spatial heterogeneity.