
Figures & data
Figure 1. LSLAs flows between investors countries and host countries in Asia (all signed deals) in 2000–2022 period from our database.
This figure represents a chord diagram plot which depicts cumulative LSLAs flows between countries. A chord diagram consists of two main components: an outer fragmented circle and inner arcs. Every fragment of the outer circle represents a country. The size of every fragment is proportional to the cumulated land deal size which involves that country, whether as host or investor. On the other hand, the size of an inner arc is proportional to the land deal size negotiated between the two countries linked.
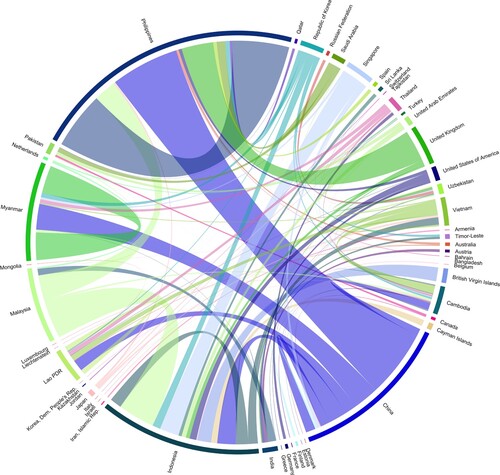
Table 1. Variables description.
Table 3. PPML estimation gravity models.
Table 2. Descriptive statistics.
DATA AVAILABILITY STATEMENT
The datasets generated during and/or analysed during the current study are available from the corresponding author on reasonable request.