
Figures & data
Table 1. EU RDI between 2002 and 2014.
Figure 1. Regional development index (RDI) in the EU in 2008.
Source: Eurostat; authors’ calculations.
A map of the different levels of development of the EU’s NUTS2 regions in 2008, as measured by a specific index. Five classes of values are used. It is noteworthy that the most developed regions were concentrated in the Centre and North of Europe, extending to the north and centre of Spain and Italy. The poorest regions were mainly in the East and in the South.
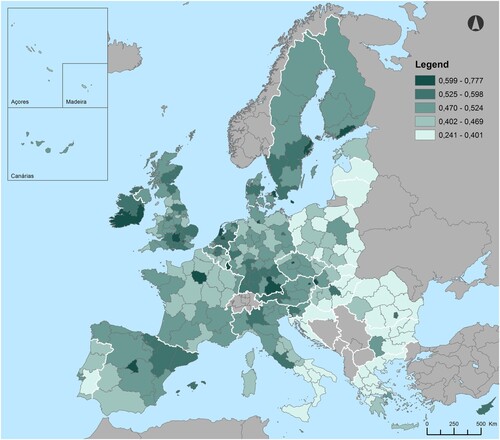
Figure 2. RDI change in the EU, 2008–2014.
Source: Eurostat; authors’ calculations.
A map of the evolution of regional development of the EU’s NUTS2 regions between 2008 and 2014. Five classes of values are used. Many of the NUTS2 regions in the more developed central and northern EU countries had the biggest gains over this period. Many less developed regions of the South were losers.
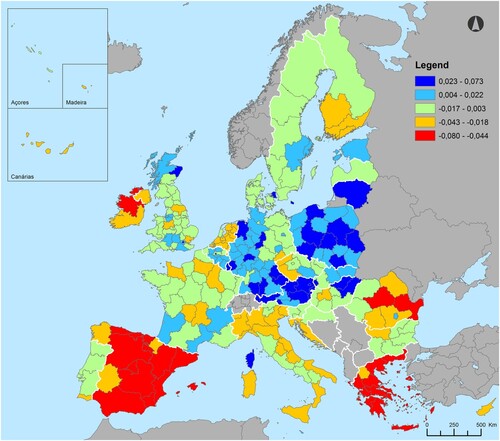
Table 2. Brazil RDI between 2002 and 2014.
Figure 3. Regional development index (RDI) in Brazil in 2008.
Source: IBGE, RAIS and Ipeadata; authors’ calculations.
A map of the different levels of regional development in Brazil in 2008, using the states as territorial units, measured by a specific index. Five classes of values are used. The most developed regions were concentrated in the Southeast and South of the country. The poorest regions were mainly in the Northeast and the North.
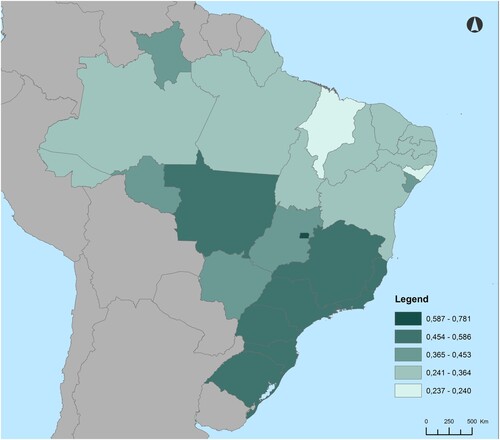
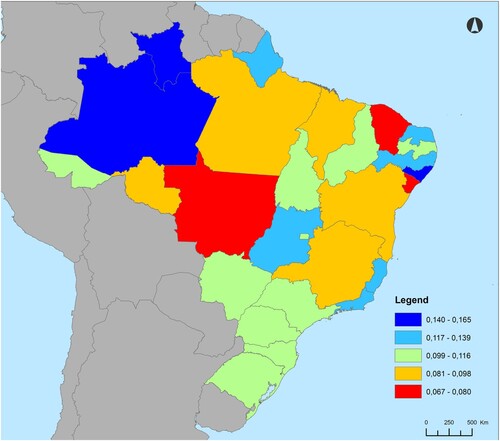
Figure 4. RDI change in Brazil, 2008–2014.
Source: IBGE, RAIS and Ipeadata; authors’ calculations.
A map of the evolution of regional development in Brazil between 2008 and 2014. Five classes of values are used. Many of the NUTS2 regions in the more developed central and northern EU countries had the biggest gains over this period. Many less developed regions of the South were losers. Higher gains occurred in states of the Northeast and North. Southeast and South states had an evolution close to the national average.
Supplemental material