
Figures & data
Table 1. Established definitions of IG. The ‘narrow’ and ‘broad’ descriptions were also used by Hughes and Lupton (Citation2016) and Waite et al. (Citation2020).
Figure 1. Map: Scotland and the Highlands and Islands, showing places referred to in the text.
Source: Spatial data shown: Appendix 1.
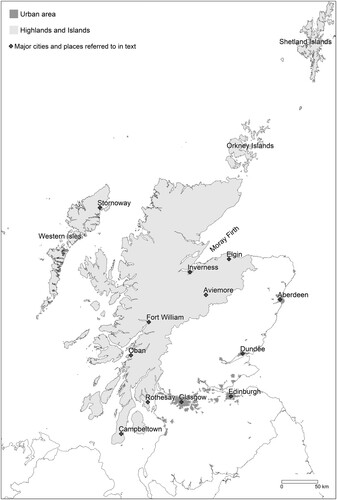
Figure 2. Simplified overview of the research which contributed to this paper. Labels referred to in the text. Part of the framework represents the Inclusive Growth Monitor.
Source: Beatty et al., Citation2016.
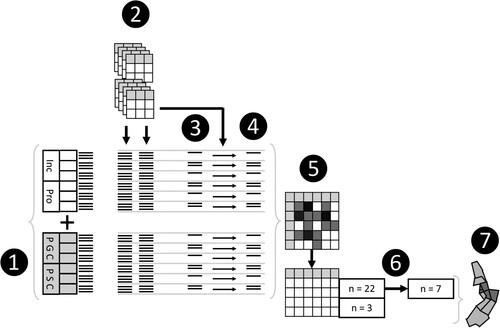
Table 2. IG framework.
Table 3. Indicators included in the dataset: raw data sources and descriptive statistics (to two decimal places).Footnote10
Figure 3. Maps: intrinsic dimensions of IG performance.
Source: Spatial data shown: Appendix 1.
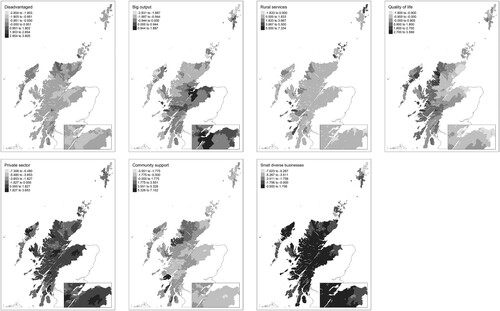
Table 4. Factor analysis: 22 standardised variables, oblimin rotation.
Figure 4. Map: five cluster typology.
Source: Spatial data shown: Appendix 1.
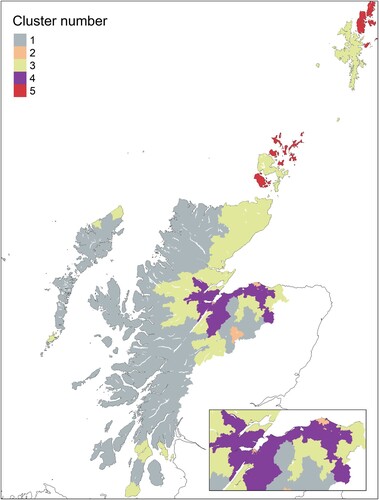
Table 5. Descriptive statistics showing means and standard deviations (in brackets) to two decimal places and distribution of Data Zones.
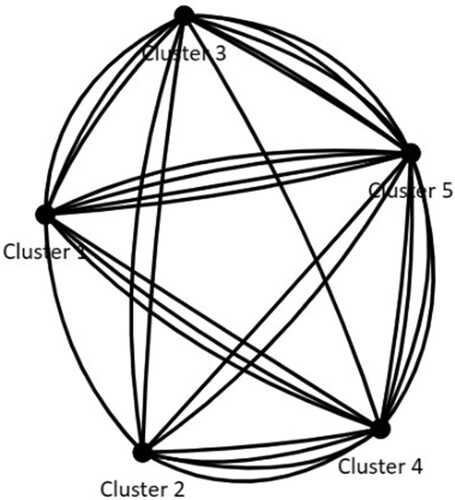
Figure 5. Graph: the number of variables (intrinsic dimensions of IG performance, demographic variables) which are not significantly different between each pair of clusters.
Supplemental Material
Download PDF (285.1 KB)DATA AVAILABILITY STATEMENT
The data that support the findings of this study are available from the corresponding author upon reasonable request.