Figures & data
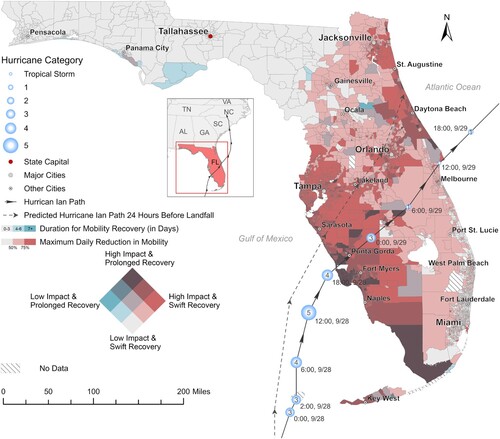
Figure 1. Bivariate map illustrating maximum daily mobility reductions and duration for mobility recovery across Florida’s census tracts throughout Hurricane Ian.
Source: Data gathered from Spectus (Cuebiq, Inc.), NOAA National Hurricane Center, United States Census Bureau
“The figure shows the maximum daily mobility reduction and recovery duration for each tract. Tracts with longer recovery periods also had greater mobility reductions, notably in coastal neighbourhoods around Fort Myers where the hurricane made landfall, exhibiting both high impact and prolonged recovery. Inland, the impact lessened as the hurricane weakened.”.