Figures & data
Figure 1. (a) Preoperative T2-weighted midsagittal MRI image and (b) Transperineal ultrasound image for a single patient. Preoperative membranous urethral length (MUL) is measured from the prostatic apex to the point of entry of the membranous urethra at the penile bulb.
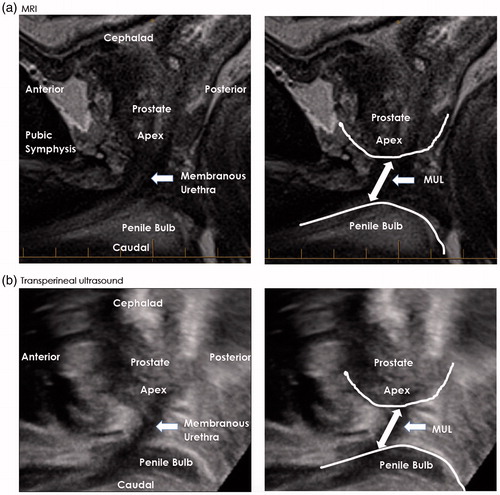
Figure 2. Preoperative transperineal ultrasound (TPUS) images for a single patient a) at rest and b) during voluntary pelvic floor muscle contraction. The anterior/superior displacement of the apex of the prostate, dorsal compression of the membranous urethra by the action of the striated urethral sphincter and compression of the penile bulb (BU) during the cine-loop image sequences was used to identify and/or confirm the prostatic apex, membranous urethra and the BU for the measurement of membranous urethral length using TPUS.
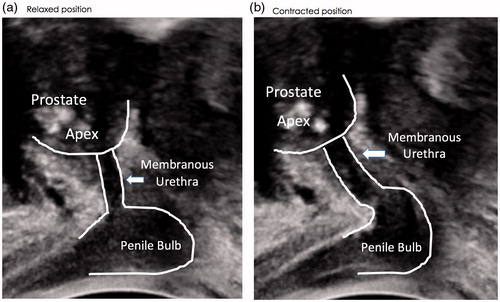
Table 1. Patient characteristics.
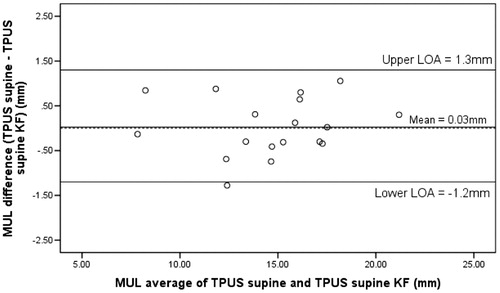
Figure 3. Bland-Altman plots of bias. Mean difference (central solid line), with 95% limits of agreement (upper and lower solid lines) for the TPUS measurements in a) supine with knees extended (supine) and b) supine with the knees flexed to 70 degrees (supine KF).
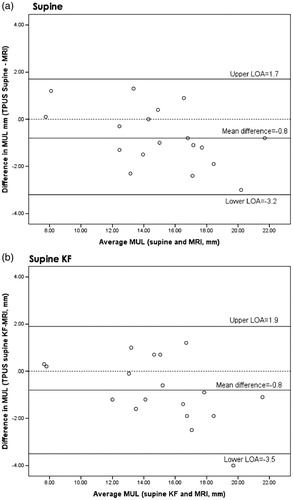
Figure 4. Bland-Altman plots of bias. Mean difference (central solid line) with 95% limits of agreement (upper and lower solid lines) for the TPUS measurements in supine with knees extended (supine) and supine with the knees flexed to 70 degrees (supine KF).