Figures & data
Figure 1. To evaluate the influence of bicalutamide and goserelin treatment on A.I.P. disease activity, spot urine samples were collected in light-protected containers two times a week over a 5-week period in the beginning of treatment. Urine (a) P.B.G., (b) A.L.A. and (c) total porphyrins were analysed using kits from Bio-Rad (Hercules, CA). P.B.G. and A.L.A. are given as µmol/mmol creatinine, while total porphyrins are given as nmol/mmol creatinine. The reference change values of (a) U-P.B.G., (b) U-A.L.A. and (c) U-total porphyrins were calculated from the published biological coefficients of variation (C.V.B) and analytical coefficients of variation (C.V.A) and are indicated in each panel as dotted lines. The arrow indicates the start of treatment with bicalutamide and goserelin.
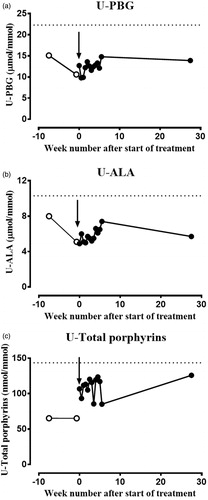
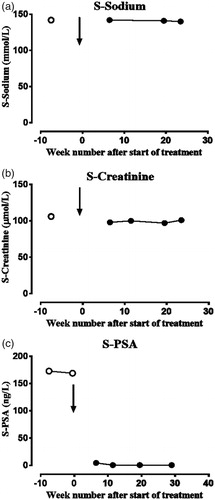
Figure 2. The serum levels of (a) sodium, (b) creatinine and (c) prostate-specific antigen (P.S.A.) during the treatment with bicalutamide and goserelin. Serum sodium and creatinine were analysed on a Siemens ADVIA 1800 instrument and serum P.S.A. on Siemens Centaur X.P.T. The results are given as sodium (mmol/L), creatinine (µmol/L) and P.S.A. (ng/L). The arrow indicates the start of treatment with bicalutamide and goserelin.