Figures & data
Table 1. Baseline characteristics of OAB patients and healthy volunteers.
Figure 1. (a) Mean distribution of daily voids and mean voided volume for each degree of urge between patients and volunteers (n = absolute number of participants who experienced this degree of urge); Urge 0: 0.9 vs 0.5 voids/day, p = 0.001; Urge 1: 3.3 vs 2.3 voids/day, p < 0.001; Urge 2: 1.9 vs 4.0 voids/day, p < 0.001; Urge 3: 0.4 vs 3.6 voids/day, p < 0.001. (b) Mean voided volume per urge (number above measurement) mean ± SD. Urge 0: p = 0.010; Urge 1: p < 0.001; Urge 2: p < 0.001; Urge 3: p = 0.001. (c) Mean bladder fullness sensation at 100 ml per degree of urge (number above measurement) mean ± SD. Urge 0: p = 0.069; Urge 1: p = 0.001; Urge 2: p = 0.001; Urge 3: p = 0.008.
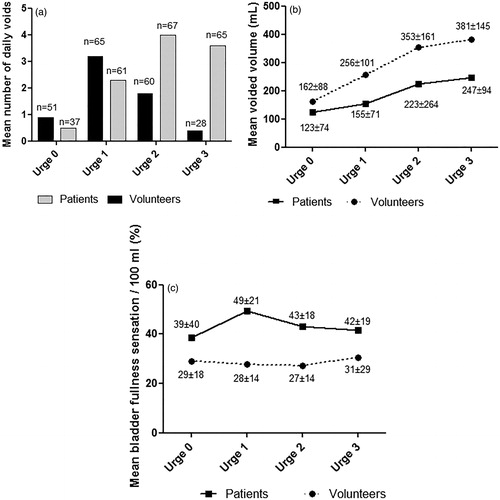
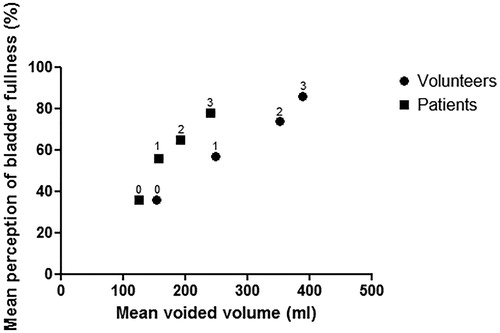
Figure 2. Mean bladder fullness vs mean voided volume for each degree of urge. The mean bladder fullness for each degree of urge is plotted against the mean voided volume corresponding with the same degree of urge (number above measurement). Urge 0: p = 0.883; Urge 1: p = 0.189; Urge 2: p = 0.064; Urge 3: p = 0.053.