Figures & data
Figure 1. Flow chart of inclusion of all evaluated patients. UBC: Urinary bladder cancer. MIBC: Muscle-invasive bladder cancer. cT: Clinical staging of the primary tumor; cN: Clinical staging of regional lymph nodes; cM: Clinical staging of distant metastases.
![Figure 1. Flow chart of inclusion of all evaluated patients. UBC: Urinary bladder cancer. MIBC: Muscle-invasive bladder cancer. cT: Clinical staging of the primary tumor; cN: Clinical staging of regional lymph nodes; cM: Clinical staging of distant metastases.](/cms/asset/864c8de5-7173-43a6-83e9-1bdaefab33e1/isju_a_1716067_f0001_b.jpg)
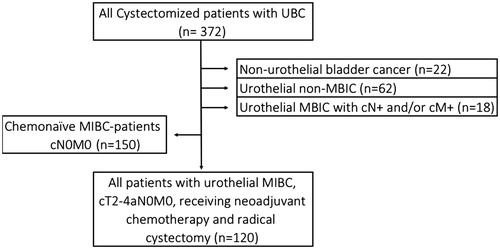
Table 1. Patient Characteristics and group comparison (%).
Figure 2. Kaplan–Meier overall survival curve for all patients with urothelial muscle-invasive bladder cancer (cT2-T4aN0M0) undergoing neoadjuvant chemotherapy and radical cystectomy between 2008 and 2014 at four Swedish cystectomy centers (n = 120). The cohort was divided into two groups depending on if the patients received blood transfusions during NAC, or not (blood yes and blood no).
![Figure 2. Kaplan–Meier overall survival curve for all patients with urothelial muscle-invasive bladder cancer (cT2-T4aN0M0) undergoing neoadjuvant chemotherapy and radical cystectomy between 2008 and 2014 at four Swedish cystectomy centers (n = 120). The cohort was divided into two groups depending on if the patients received blood transfusions during NAC, or not (blood yes and blood no).](/cms/asset/09c3ddba-0f1b-4342-9303-0547c94691a4/isju_a_1716067_f0002_c.jpg)
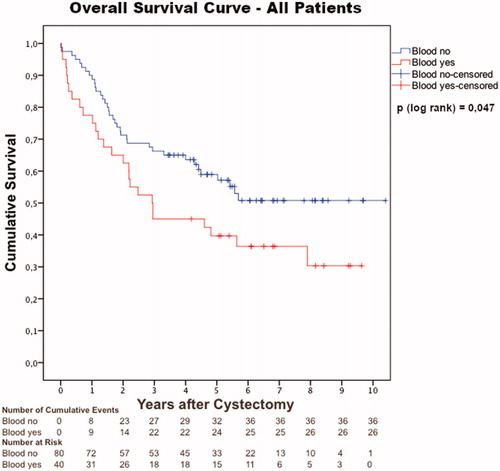
Table 2. Cox proportional hazard model.