Figures & data
Table 1. Assessment of treatments in order to define an optimal treatment in the study.
Table 2. Baseline and treatment characteristics of the study population.
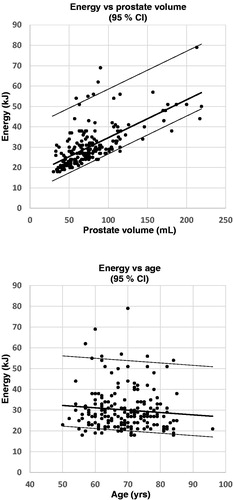
Figure 1 a and b. The figures are derived from the multiple linear regression analysis of baseline prostate volume (1a (upper figure), r = 0.98) and age (1b (lower figure), r = 0.14) as the independent variables versus energy delivery as the dependent variable. The broad solid middle line represents the regression line and the thin solid lines on each side represents the upper and lower 95% confidence interval. All cases judged as optimal were included in the analysis and each case is represented by a black dot (n = 199).