Figures & data
Figure 1. Consort diagram of this study.
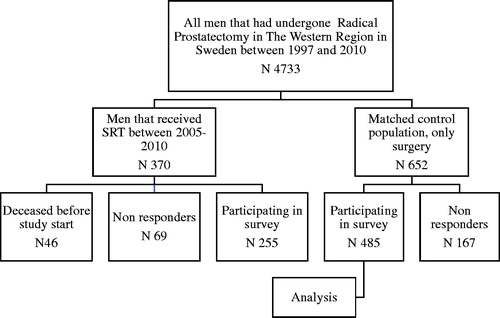
Table 1. Patient and treatment characteristics.
Figure 2. Relative risk ratios and 95% confidence intervals for the risk of side-effects SRT versus reference group.
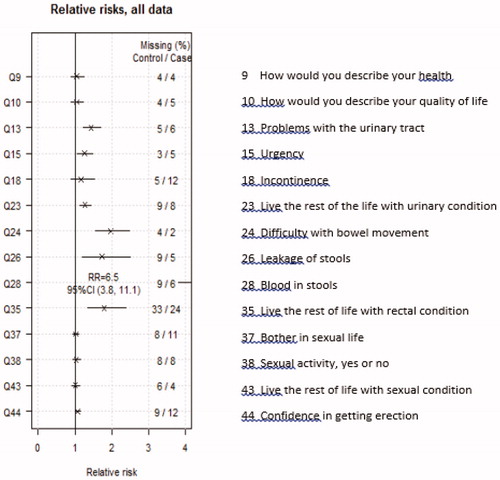
Figure 3. The intensity of symptoms and quality-of-life assessments when significant differences between SRT and reference were found. Percentage of total on column. Blue = SRT; Red = reference group. ‘1’ not at all, ‘2’ a little, ‘3’ to some extent, ‘4’’ very much.
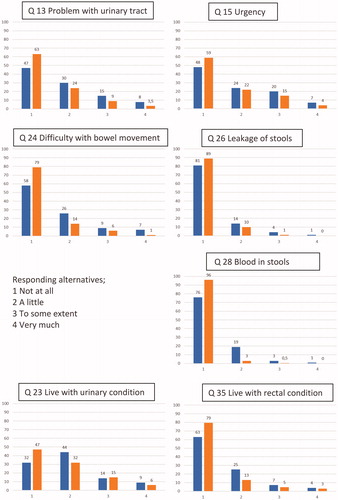
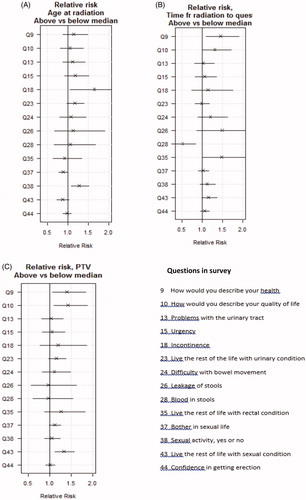
Figure 4. (a) Relative risk, age at surgery, dichotomized at its median, SRT; (b) Relative risk, time to survey, dichotomized at its median, SRT; (c) Relative risk ratios and 95% confidence intervals for the risk of side-effects, PTV versus scores, SRT.