Figures & data
Figure 1. Flowchart showing exclusions and study population.
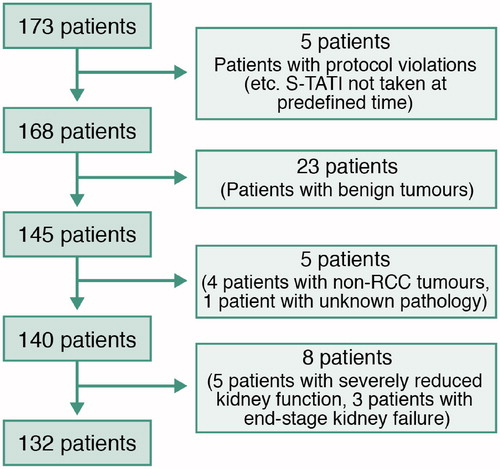
Table 1. Table of demographic and histological features of patients and tumours.
Figure 2. ROC curve analysis. ROC curve analysis of S-TATI and P-CRP for overall mortality of RCC patients.
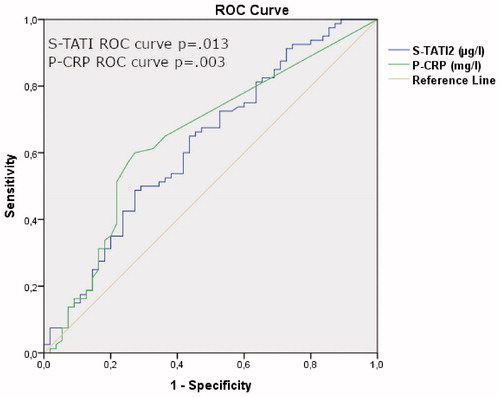
Figure 3. Distribution of S-TATI according to disease. Box plots displaying s-TATI distribution according to malignancy (a), tumour stage (b), nodal stage (c) and metastatic stage (d). Boxes show 25th, 50th and 75th percentiles, whiskers show 5th and 95th percentiles. Outliers are represented with circles while black stars represent extreme outliers. Figure (a) includes benign tumours, but other figures include only malignant tumours.
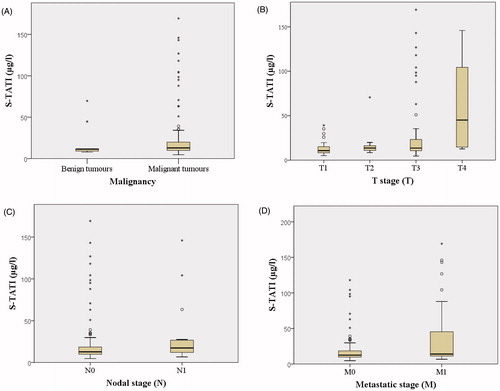
Table 2. Univariate and multivariate analyses of postoperative S-TATI, other prognostic factors and RCC overall survival.*
Table 3. Univariate and multivariate analyses of postoperative S-TATI, other prognostic factors and RCC cancer-specific survival.*
Figure 4. Overall survival of 132 patients with renal cell carcinoma by concentration of postoperative s-TATI.
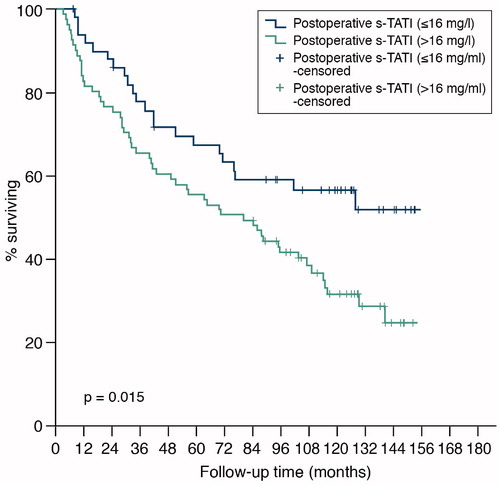
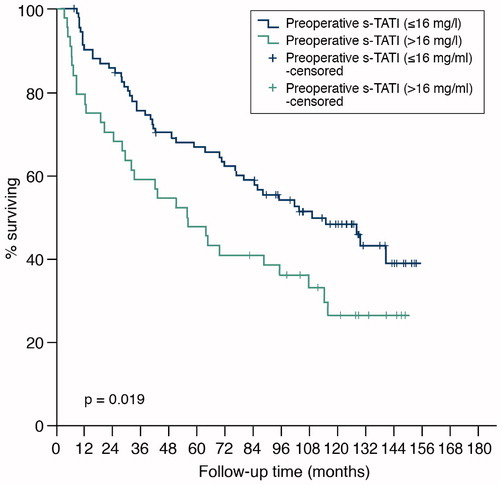
Figure 5. Overall survival of 136 patients with renal cell carcinoma by concentration of preoperative s-TATI.