Figures & data
Table 1. Characteristics of T1 BC patients diagnosed from 2008-2012 in Norway.
Figure 1. Early and delayed treatment for T1 BC patients. Treatments considered are conservative treatments with and without BCG and RC. The histograms show the distribution of time since diagnosis of the respective delayed treatments.
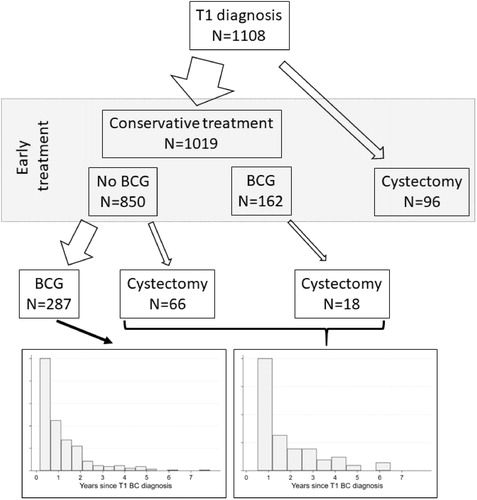
Table 2. Patient characteristics for T1 BC patients receiving conservative treatment or cystectomy as early treatment. P-values indicate the effect of the respective patient characteristics on early BCG and RC treatment choice when compared to conservative treatment without BCG in a multivariable model.
Figure 2. Cause-specific survival (CSS) and overall survival (OS) of T1 BC patients in Norway.
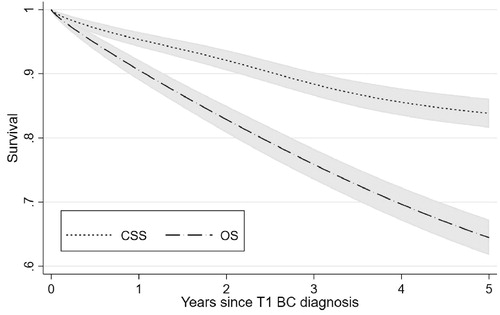
Table 3. Results from the cause-specific and overall survival analysis. A hazard ratio HR > 1 indicates a higher mortality risk compared to the reference group, HR < 1 a lower risk respectively. We also provide confidence intervals (CI) and p-values.
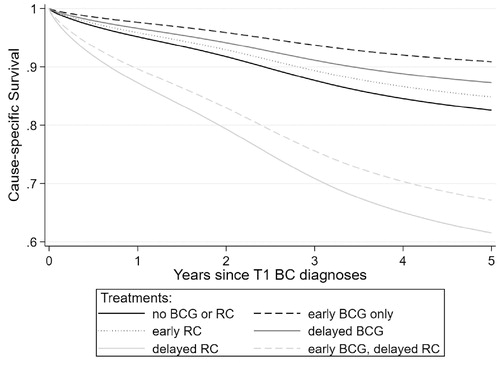
Figure 3. Cancer-specific survival for T1 BC patients in Norway dependent on combined early and delayed treatment.