
Figures & data
Table 1. Number of tumour events included in the validation per selected year (corresponding to 10% of all reported patients to the National Swedish Kidney Cancer Register during each year).
Figure 1. Number of days (median) from date of diagnosis to date of patient being reported to the National Swedish Kidney Cancer Register.
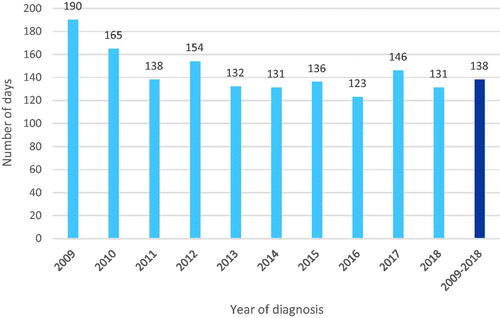
Figure 2. Cumulative proportion (%) of patients reported to the National Swedish Kidney Cancer Register (NSKCR) at 3, 6 and 12 months after date of diagnosis in 2010, 2013 and 2016.
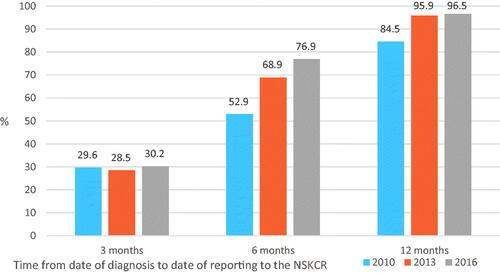
Table 2 Results from the comparison between original and reabstracted data of the diagnostics and primary treatment form in the National Swedish Kidney Cancer Register (NSKCR).
Table 3. Agreement between original NSKCR data and reabstracted data for ‘N classification’.
Table 4. Agreement between original NSKCR data and reabstracted data for ‘M classification’ for 2007 and 2010.
Table 5. Agreement between original NSKCR data and reabstracted data for ‘M classification’ for 2013 and 2016.