
Figures & data
Table 1. Patient characteristics, n = 69.
Table 2. Pre-, peri- and postoperative sPLND data stratified on mode of sPLND.
Table 3. Oncological results during follow-up (n = 69).
Figure 1. Relative PSA-changes (post- versus preoperative values) after robotic sPLND are plotted in descending order from left to right with each bar depicting one patient.
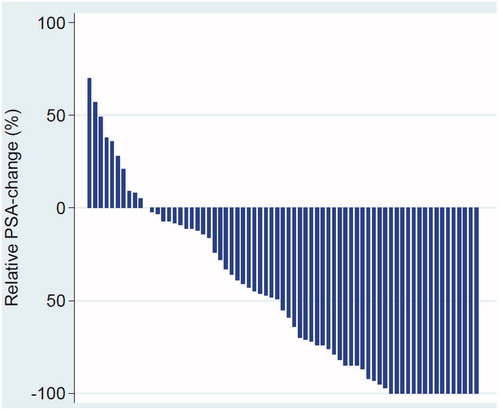
Figure 2. Difference in PSA value pre-sPLND between patients without and with treatment response.
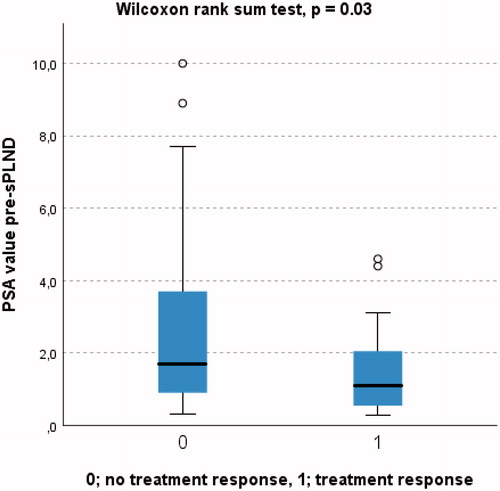
Figure 3. Covariates associated with treatment response (PSA < 0.2 ng/ml) in multivariate logistic regression. GGG: ISUP Gleason Grade Group.
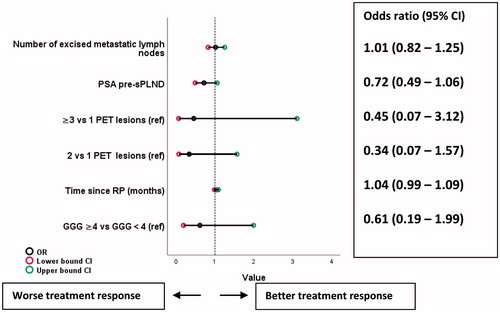
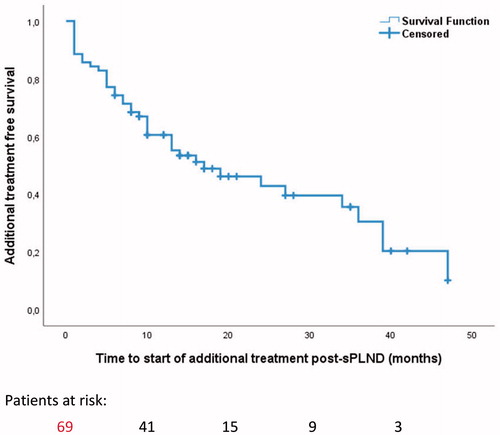
Figure 4. Survival without additional treatment post-sPLND.
Supplemental material