
Figures & data
Table 1. Characteristics of men with prevalent prostate cancer who died from COVID-19 (cases), and their matched controls in PCBaSe RAPID 2019.
Figure 1. Forest plot of associations between exposure to any ADT and COVID-19 mortality. Estimated odds ratios are represented by squares and 95% confidence intervals are represented by horizontal whiskers (variables adjusted for in each step are described in the methods section and in footnotes). GnRH: gonadotropin-releasing hormone
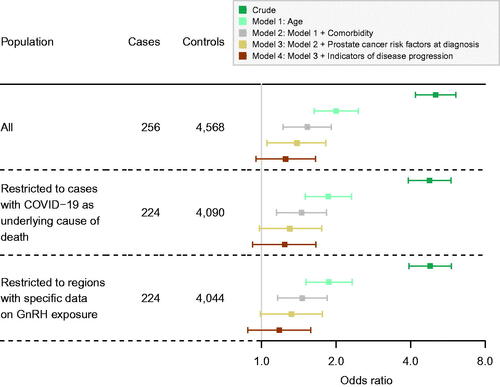
Table 2. Odds ratios (ORs) with 95% confidence intervals (CIs) for the association between ADT exposure and COVID-19 death (underlying or contributing cause) in men with prostate cancer in PCBaSe RAPID 2019.
Table 3. Sensitivity analyses: odds ratios (ORs) with 95% confidence intervals (CIs) for the association between ADT exposure and COVID-19 death in men with prostate cancer in PCBaSe RAPID 2019.
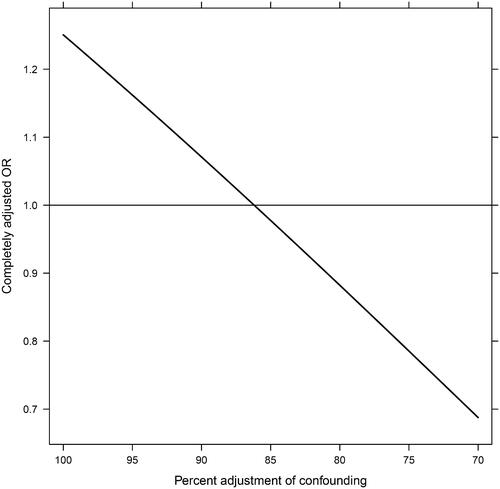
Figure 2. Quantitative evaluation of impact of potential residual confounding. Interpolation of regression coefficients based on the change from the crude estimate to the maximally adjusted estimate. The curve describes the relation between percent adjustment of confounding and the resulting completely adjusted odds ratio (causal effect). The calculation is based on the maximally adjusted odds ratio from the main analysis (the intercept). OR: odds ratio
Supplemental Material
Download PDF (224.8 KB)Data availability statement
Data used in the present study was extracted from the Prostate Cancer Database Sweden (PCBaSe), which is based on the National Prostate Cancer Register (NPCR) of Sweden and linkage to several national health-data registers. The data cannot be shared publicly because the individual-level data contain potentially identifying and sensitive patient information and cannot be published due to legislation and ethical approval (https://etikprovningsmyndigheten.se). Use of the data from national health-data registers is further restricted by the Swedish Board of Health and Welfare (https://www.socialstyrelsen.se/en/) and Statistics Sweden (https://www.scb.se/en/) which are Government Agencies providing access to the linked healthcare registers. The data will be shared on reasonable request in an application made to any of the steering groups of NPCR and PCBaSe. For detailed information, please see www.npcr.se/in-english, where registration forms, manuals, and annual reports from NPCR are available alongside a full list of publications from PCBaSe. The statistical program code used for the present study analyses can be provided on request (contact [email protected]).