
Figures & data
Figure 1. The age-standardized incidence bladder cancer per 100,000 inhabitants in Sweden stratified by gender (men: dark yellow; women: yellow).

Table 1. The EAU 2021 prognostic risk groups based on WHO 1973 and/or WHO 2016 grading system.
Table 2. Probabilities of disease progression to muscle invasion or distant metastases at 1, 5 and 10 years according to the EAU 2021 prognostic risk groups.
Figure 2. Annual proportion (%) of patients with bladder cancer stage T1–T4 or upper tract urothelial carcinoma discussed at a multidisciplinary tumor board (MDT) between 2016 and 2020 in Sweden stratified by health care region (Uppsala-Örebro (
 ), Southern (
 ), Stockholm-Gotland (
 ), Southeastern (
 ) and Western (
 ) health care regions) as well as visualizing the compiled national proportion (
 ).
).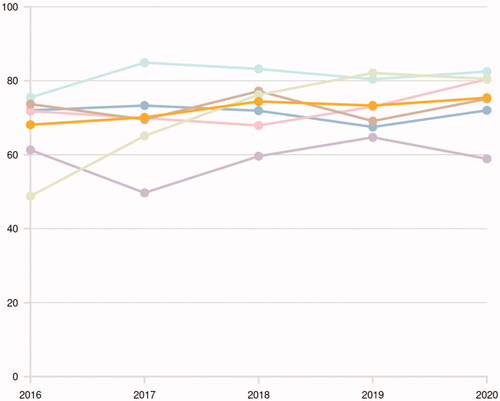
Figure 3. Proportion (%) of patients with bladder cancer stage T1–T4 or upper tract urothelial carcinoma discussed at a multidisciplinary tumor board (MDT) between 2016 and 2020 in Sweden stratified by region. Each blue bar represents a region and the yellow bar the whole Swedish population, where the colours delineate p-values compared to the national proportions with the following colour-codes 
 p < 0.05.
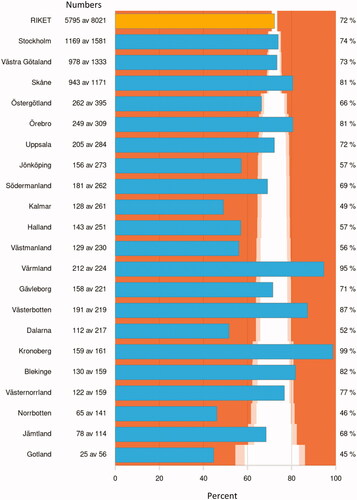
Figure 4. Proportion of patients with non-muscle invasive bladder cancer with the presence of detrusor muscle in the resected specimen between 2018 and 2020 stratified by treating hospital. Each blue bar represents a hospital and the yellow bar the whole Swedish population, where the colours delineate p-values compared to the national proportions with the following colour-codes 
 p < 0.05 .
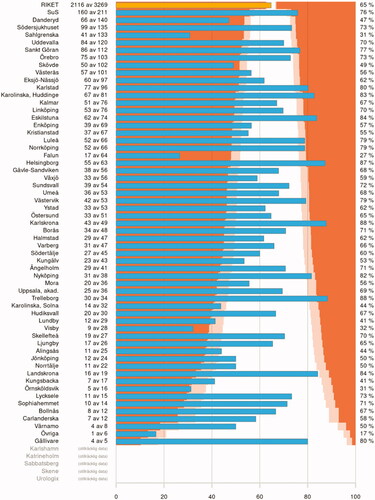
Figure 5. Annual proportion (%) of patients with bladder cancer stage T1–T4 or upper tract urothelial carcinoma receiving a patient navigator at diagnosis in Sweden stratified by health care region (Uppsala-Örebro (
 ), Southern (
 ), Stockholm-Gotland (
 ), Southeastern (
 ) and Western (
 ) health care regions) as well as visualizing the compiled national proportion (
 ).
).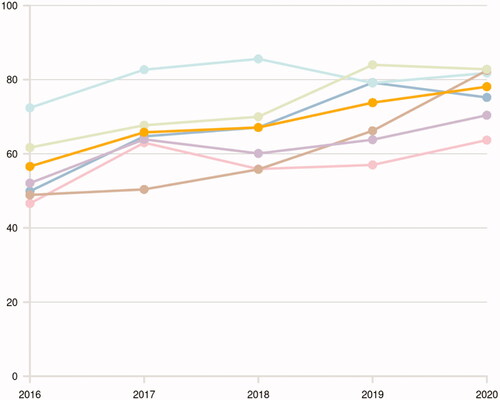
Table 3. Main differences between the new Swedish national guidelines and the current EAU guidelines from 2021.