
Figures & data
Table 1. Definitions of study outcomes.
Figure 1. Patient flowchart. PSA = prostate-specific antigen.
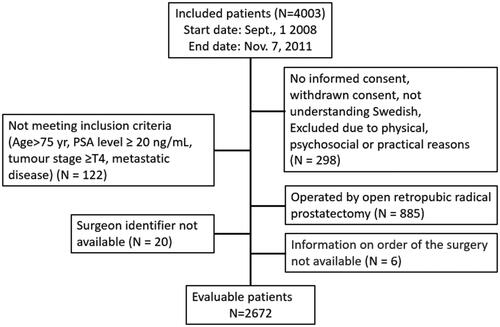
Figure 2. Left panel: percentage of patients with a negative surgical margin (no cancer cells in the surgical margin of specimens) as found in the pathology report. Right panel: predicted cumulative chance of freedom from biochemical recurrence 4 years after surgery. The unadjusted curve (blue dashed line) represents estimates from regression with no covariates included. The adjusted curve (red solid line) represents estimates from regression with covariates included. The grey area is the 95% confidence interval (CI) for adjusted estimates. Black dots depict raw proportions with 95% CI. The number of surgeons performing at least 1, 50, 200, 500 and 750 surgeries is given at the bottom of the left panel.
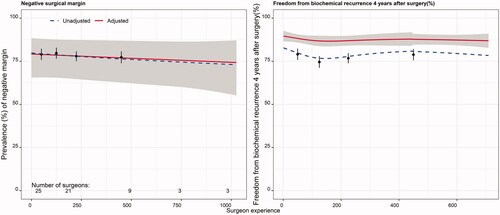
Figure 3. Percentage of patients reporting urinary continence (defined as change of sanitary pad less than once per 24 h) at 3, 12 and 24 months postoperatively. The unadjusted curve (blue dashed line) represents estimates from regression with no covariates included. The adjusted curve (red solid line) represents estimates from regression with covariates included. The grey area is the 95% confidence interval (CI) for adjusted estimates. Black dots depict raw proportions with 95% CI. The number of surgeons performing at least 1, 50, 200, 500 and 750 surgeries is given at the bottom of the left panel.
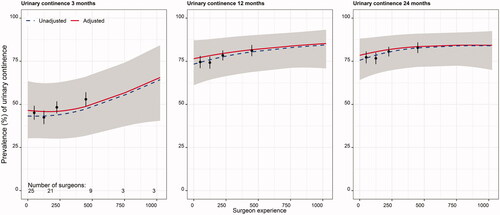
Figure 4. Percentage of patients reporting erectile function (defined as having a stiff enough penis for penetration after sexual stimulation at least 50% of times) at 3, 12 and 24 months postoperatively. The unadjusted curve (blue dashed line) represents estimates from regression with no covariates included. The adjusted curve (red solid line) represents estimates from regression with covariates included. The grey area is the 95% confidence interval (CI) for adjusted estimates. Black dots depict raw proportions with 95% CI. The number of surgeons performing at least 1, 50, 200, 500 and 750 surgeries is given at the bottom of the left panel.
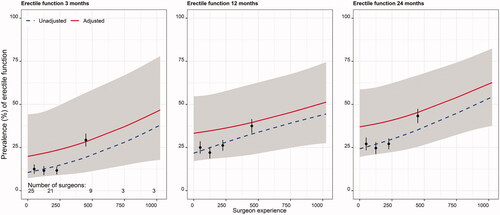
Table 2. Patient, tumour and surgeon characteristics.