Figures & data
Table 1. Characteristics for men with non-metastatic castration sensitive prostate cancer in the Uppsala-Örebro PSA Cohort and in the Stockholm PSA and Biopsy Register with GnRH as primary treatment.
Figure 1. Heat map of the combined effects of pre-GnRH PSA and post-GnRH PSA on the risk of castration-resistant prostate cancer. The straight parallel level curves indicate that there is no interaction between pre-GnRH PSA and post-GnRH PSA. Since they align vertically, post-GnRH PSA is sufficient to describe the risk of CRPC. The red area reflects an increased risk of CRPC. Time to CRPC was not possible to assess for 50 men (grey area) since they already had reached CRPC at date of post-GnRH PSA.
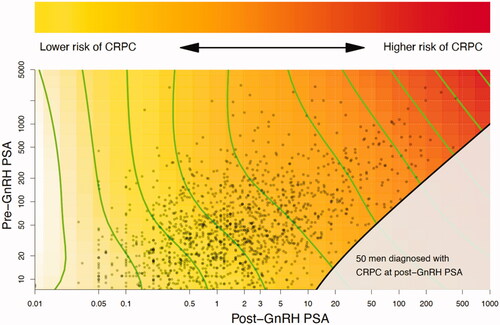
Figure 2. Risk of castration-resistant prostate cancer according to characteristics at date of pre-GnRH PSA and post-GnRH PSA. C-index and hazard ratios (HR) for univariable and multivariable Cox regression models. Multivariable models included the variables at date of pre-GnRH PSA and post-GnRH PSA. Abbreviations: C: C-index; M0: no metastases on bone scintigraphy; MX: bone metastases not assessed; ISUP: Pca grading according to the International Society of Urological Pathology; CCI: Charlson comorbidity index.
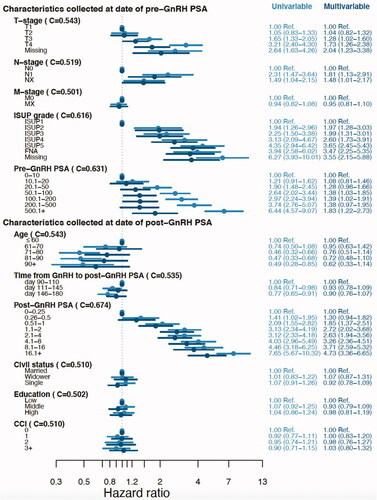
Figure 3. Kaplan-Meier estimates of time to castration-resistant prostate cancer for men in the low-, intermediate- and high-risk groups of CRPCrisk-score. Risk groups are defined by post-GnRH PSA and ISUP grade on diagnostic biopsy. Median time to CRPC was 1.5 years for men above the top tertile and 7.8 years for men bellow the bottom tertile. Shadowing represents 95% confidence interval.
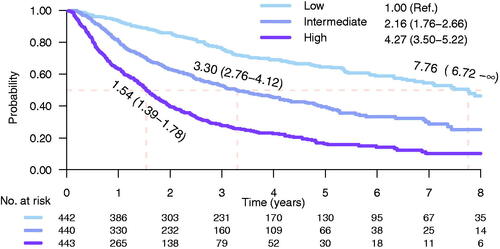
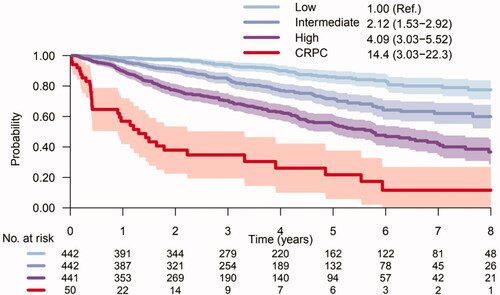
Figure 4. Risk of prostate cancer death for men in the low-, intermediate- and high-risk groups of CRPCrisk-score. Risk groups are defined by post-GnRH PSA and ISUP grade on diagnostic biopsy. Risk of Pca death for men that already had reached CRPC at date of post-GnRH PSA is given by the red curve. Shadowing represents 95% confidence interval.