Figures & data
Figure 1. Experimental set-up with porcine kidney, temperature sensors and flexible ureteroscope with laser fiber.
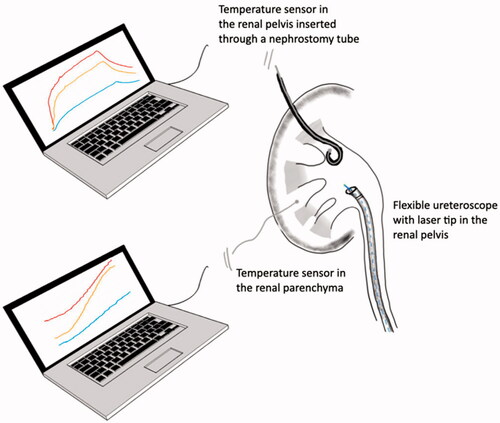
Figure 2. Temperature profiles in the renal pelvis for different laser settings using 150 μm, 200 μm and 270 μm fibers. For every laser fiber, 20 W produced significantly higher temperatures than 8 W and 8 W significantly higher temperatures than 2.4 W, p < 0.001. For 200 μm and 270 μm fibers, 30 W produced significantly higher temperatures compared to 20 W, p < 0.001 (Wilcoxon).
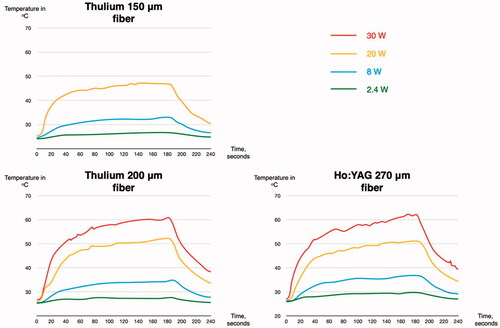
Figure 3. Temperature profiles in the renal pelvis comparing 150 μm, 200 μm and 270 μm fibers at different laser settings. Besides the 20 W settings for the two largest fibers, the 270 μm fiber produced significantly higher temperatures than the 200 μm fiber and the 200 μm fiber significantly higher temperatures than the 150 μm fiber for any laser setting, p < 0.001 (Wilcoxon).
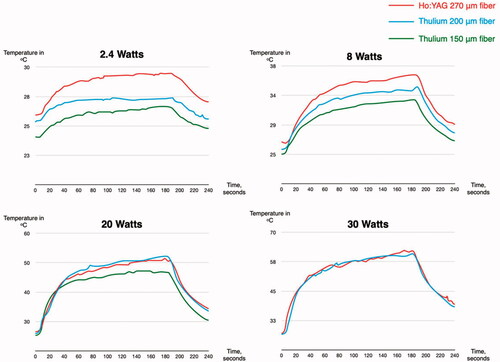
Table 1. Comparing baseline and peak temperatures in the renal pelvis and the parenchyma.
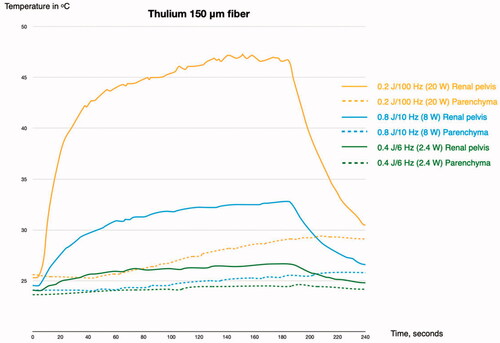
Figure 4. Temperature profiles in the renal pelvis and parenchyma for different laser settings using 150 μm fiber. The laser was activated for 180 seconds before being idled for 60 seconds.