
Figures & data
Figure 1. Flow chart of patient inclusion in the study. BCR: Biochemical recurrence; HT: Hormonal therapy; PC: Prostate Cancer.
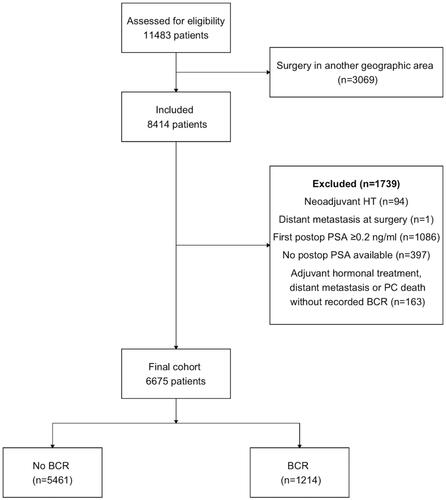
Figure 2. Number of radical prostatectomies per year.
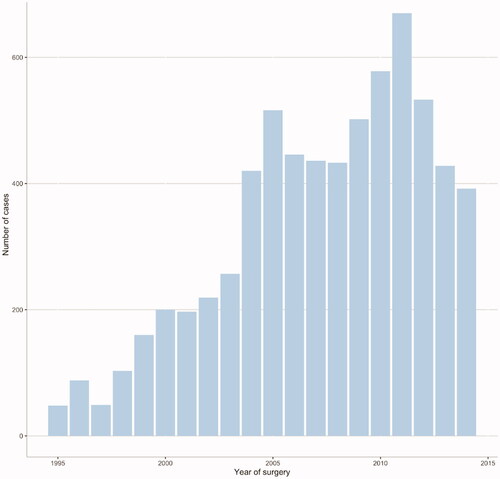
Table 1. Age, tumour characteristics and postoperative radiotherapy according to years from surgery to biochemical recurrence.
Figure 3. (a) Kaplan–Meier plot of biochemical recurrence-free survival after radical prostatectomy with 95% confidence intervals. At least one postoperative PSA <0.2 mg/ml was required for inclusion, hence there are no recurrences within the first months. Curve is truncated when number at risk falls below ten. BCR – biochemical recurrence. (b) Kaplan–Meier plot of failure-free survival after BCR according to time from surgery to BCR with 95% confidence intervals. Each curve is truncated when number at risk in the group falls below ten. BCR: Biochemical recurrence.
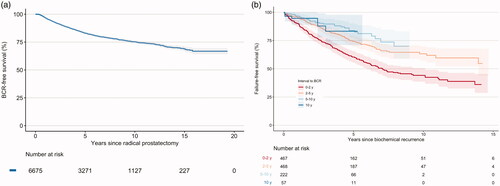
Table 2. Pairwise comparison of the distribution of failure-free survival according to category of time to biochemical recurrence as in .