
Figures & data
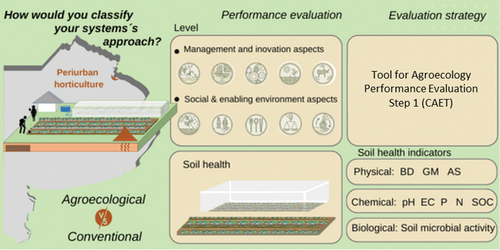
Figure 1. Location of the farms in Florencio Varela city, Buenos Aires, Argentina.
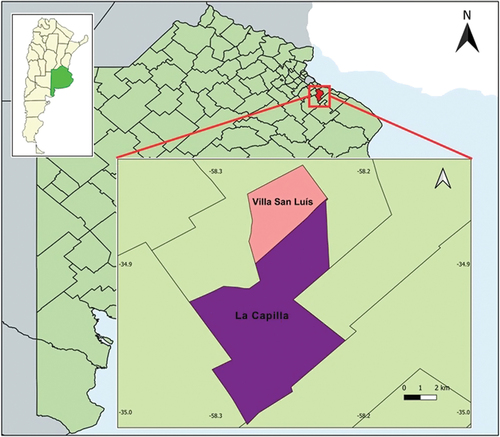
Figure 2. (a) Representative diagram of the horticultural farms. (b) Representative images of sites sampled within each farm: 1) un-cultivated soils, 2) soils from open-field production and 3) soils from greenhouse production.
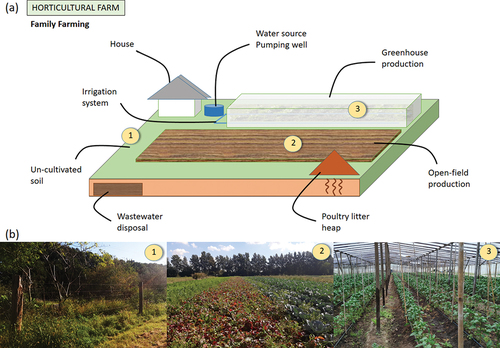
Table 1. Characterization of nine poultry litter heaps present in the farms at sampling.
Table 2. Characterization of uncultivated soils in the studied area from 0 to 10 cm depth.
Figure 3. Mean scores of the 10 Elements of agroecology for self-defined agroecological (gray; n=11) and conventional (black; n=8) systems. Statistically significant differences: *p<0.05, **p<0.01 (non-parametric Wilcoxon test).
Figure 4. Mean scores for the indices corresponding to agroecology Elements describing management and innovation aspects for self-defined agroecological (gray; n=11) and conventional (black; n=8) systems. (a) Diversity, (b) Resilience, (c) Synergies, (d) Efficiency, and (e) Recycling. ns: non-significant, *p<0.05, **p<0.01 (non-parametric Wilcoxon test).
Figure 5. Mean scores for the indices corresponding to agroecology Elements describing the social aspects and enabling environment for self-defined agroecological (gray; n=11) and conventional (black; n=8) systems. (a) Human and social Values, (b) Culture and food Traditions, (c) Circular and Solidarity Economy, (d) Co-creation and Sharing of knowledge, and (e) Responsible Governance. ns: non-significant, *p<0.05 (non-parametric Wilcoxon test).
Figure 6. First factorial plane of a principal components analysis. (a) variables factor map, each vector represents a variable and the angles between variables or components indicate the correlation between them; (b) individuals factor map; (c) qualitative factor map and (d) individuals factor map where individuals are color after their category for the variable approach. Dim1: first principal component, Dim2: second principal component, BD: bulk density, GM: gravimetric moisture, ASfw: aggregates stability fast wetting, ASst: aggregates stability stirring after pre-wetting, ASsw: aggregates stability slow wetting, pH: potential hydrogen, EC: electrical conductivity; SOC: soil organic carbon, EP: extractable phosphorus, TN: total nitrogen, SBR: soil basal respiration. OF: open field production; OFC: open field conventional, OFA: open field self-defined agroecological, A: agroecological approach, C: conventional approach, GH: greenhouse production, GHC: greenhouse production conventional and GHA: greenhouse production self-defined agroecological.
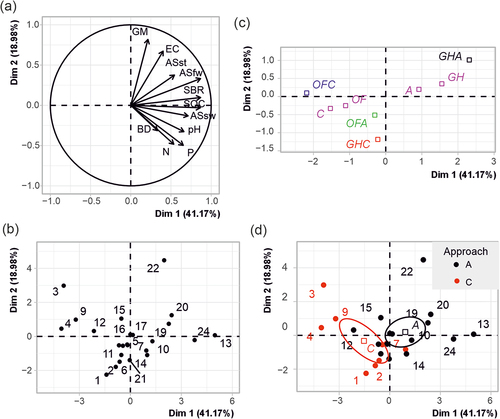
Table 3. Pearson’s correlation between the variables and the first two principal components.
Figure 7. Aggregate stability for the pre-treatment fast wetting; interaction between approach and cultivation system. MWD: mean weight diameter, OF: open-field production; GH: greenhouse production, C: conventional approach, A: agroecological approach. Different letters show significant differences between uses according to Tukey (p < 0.05). The vertical lines indicated the standard deviation.
Table 4. Physical indicators of soil health without interaction between cultivation system and approach.
Table 5. Chemical indicators of soil health, from 0 to 10 cm depth.
Table 6. Biological indicators of soil health.