Figures & data
Figure 1. Schematic representation of cadherin-catenin complexes with distinct α-catenin isoforms αE-cat, αN-cat and αT-cat. Note that there is substantial isoform diversity at the other positions in the cadherin-catenin complex, such as ∼19 classical cadherins (i.e., catenin-binding) encompassing both type I and type II forms,Citation91 three p120ctns as well as the β-catenin homologue, plakoglobin (reviewed inCitation92). For simplicity, these other isoforms are not shown with the exception of αE-cat participating in an E-cadherin complex, and αT-cat with an N-cadherin complex.
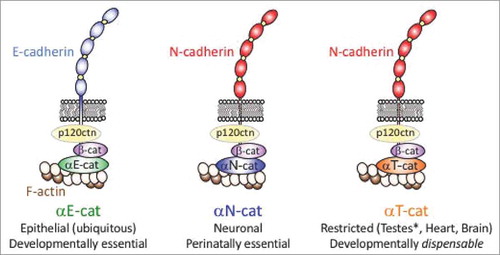
Figure 2. α-Catenin isoform expression analysis across human tissues. Graphs exported from the human Genotype-Tissue Expression (GTEx) portal using CTNNA1, CTNNA2 and CTNNA3 gene identifiers. Expression values shown as Transcripts Per Million (TPM) calculated from a gene model with isoforms collapsed to a single gene. No other normalization steps were applied. Box plots are shown as median and 25th and 75th percentiles; points are displayed as outliers if they are above or below 1.5 times the interquartile range. Number of human tissue samples range from ∼100-500 per tissue and can be viewed via the portal.
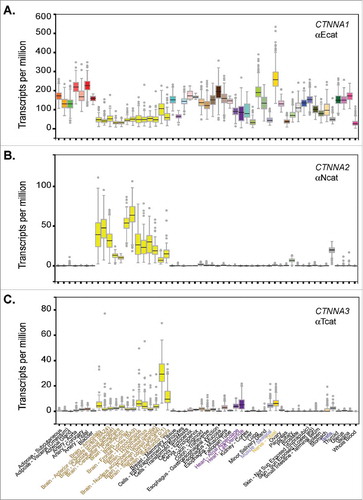
Figure 3. Mechanosensor model of αE-cat in cell-cell adhesion. The actin-binding domain (ABD) of αE-cat (green) preferentially associates with actin filaments under tension (high tension versus low tension). This leads to unfurling of the M-domain (M1), which allows vinculin binding and adherens junction reinforcement.
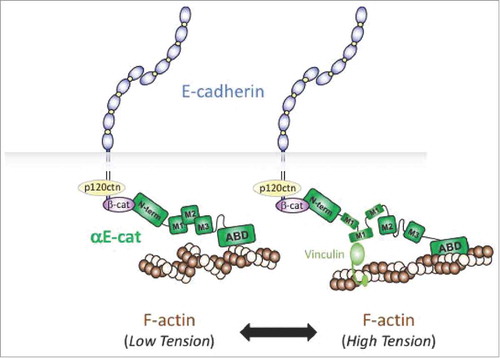
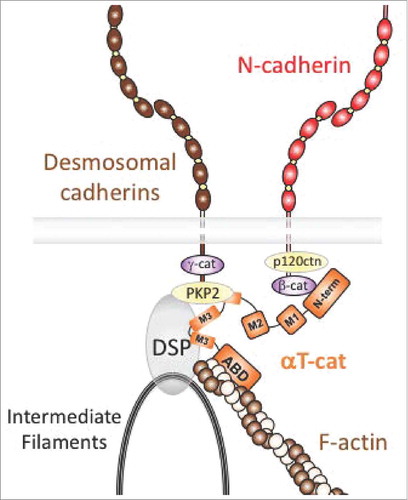
Figure 4. Model of αT-cat in cardiomyocyte cell-cell adhesion. αT-cat (orange) can interact with β-cat, actin and the desmosomal component, PKP2, via its central M-domain (end of M2 and M3), which allows for the alignment and reinforcement of a hybrid adherens junction-desmosome structure known as the area composita region of the intercalated disk. The intermediate filament-binding protein, desmoplakin (DSP), is also shown.