Figures & data
Figure 1. Effect of crush injury on sciatic nerve GDNF protein expression. Tamoxifen-induced conditional GDNF knockout (CKO) was associated with truncated sciatic nerve GDNF protein expression upregulation as measured by ELISA on day 7 following crush injury relative to its Sham surgery control. This is in contrast to the robust upregulation observed in GDNF wildtype (WT) and heterozygote (HET) mice. No differences were seen between the latter two genotypes. N = 3-4 mice per genotype in duplicate experiments. N.S. = not significant, **indicates p < 0.01.
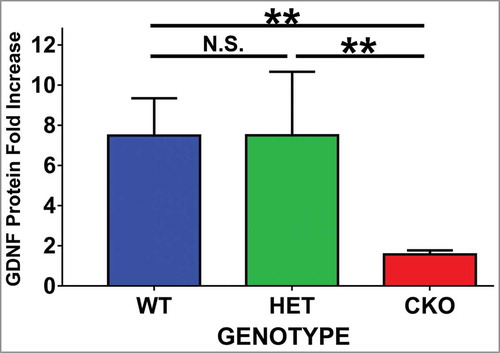
Figure 2. Early effect of crush injury on endoneurial microvascular permeability to horseradish peroxidase. Representative high magnification digital photomicrographs from the sciatic nerves of a GDNF WT mouse 2 hours following crush injury shows a horseradish peroxidase (HRP)-permeable microvessel with loss of distinct borders between endoneurial endothelial cells (EC) and pericytes (P) due to extravasation of electron-dense HRP from the lumen with a red blood cell (RBC) present (A). This is in contrast to a HRP-impermeable endoneurial microvessel from the contralateral Sham surgery control nerve with distinct borders between EC and P (white arrows) with luminal HRP and a RBC also observed. Scale bars = 500 nm.
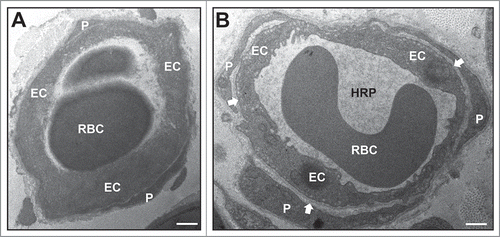
Figure 3. Quantitative effect of GDNF on sciatic nerve endoneurial microvessel HRP permeability on day 7 following crush injury. Bar histograms of mean % HRP-permeable endoneurial microvessels day 7 following sciatic nerve crush injury show significantly increased permeability in GDNF WT (blue histograms), HET (green histograms) and CKO (red histograms) mice compared to the contralateral Sham surgery controls (purple histograms) for each genotype (A). Significant reductions in permeability were seen in WT and HET mice relative to CKO mice, with no differences between the former two genotypes (B). These data imply GDNF significantly contributes to near complete recovery in restrictive BNB characteristics 7 days after nerve injury. N = 12 mice, with a total of 151 microvessels evaluated. *indicates p < 0.05, **indicates p < 0.01, ****indicates p < 0.0001 and N.S. indicates not significant. Upper indicators in the comparison bar in B depict significance relative to Sham controls, while lower indicators indicate significance relative to CKO.
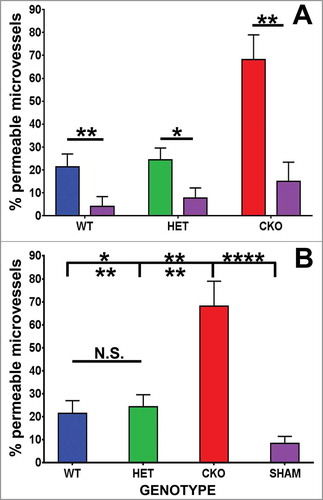
Figure 4. Qualitative effect of GDNF on sciatic nerve morphology on day 7 following crush injury. Representative digital light photomicrographs from the sciatic nerves of experimental mice 7 days following sciatic nerve crush injury at low (A, D, G) and high magnification (B, E, H) show increased axonal density in GDNF WT (A, B) and HET (D, E) mice compared to CKO mice (G, H) which demonstrates more myelin debris with evidence of active Wallerian degeneration (black arrows), consistent with previous reports demonstrating a protective role for GDNF following axonal injury. Uninjured sham surgery control nerves (C, F, I) from the same mice are also shown. Scale bars = 25 µm (C), 50 µm (B, E, F, H, I) and 200 µm (A, D, G).
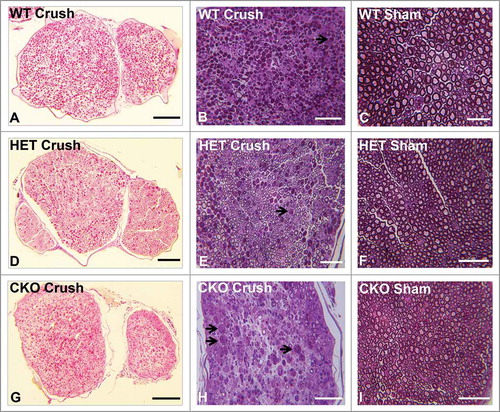
Figure 5. Qualitative effect of GDNF on sciatic nerve endoneurial microvessel HRP permeability on day 7 following crush injury. Representative digital ultramicrographs from the sciatic nerves of experimental mice 7 days following crush injury show HRP-impermeable endoneurial microvessels in GDNF WT (A) and HET (D) mice with a HRP-permeable endoneurial microvessel in a CKO mouse (G). HRP-impermeable endoneurial microvessels are seen in Sham control nerves for all genotypes (B, E, H). Less frequent HRP-permeable endoneurial microvessels are seen in WT (C) and HET (F) crush-injured nerves, with HRP-impermeable endoneurial microvessels less commonly observed in CKO crush-injured nerves (I). Scale bars = 2 µm.
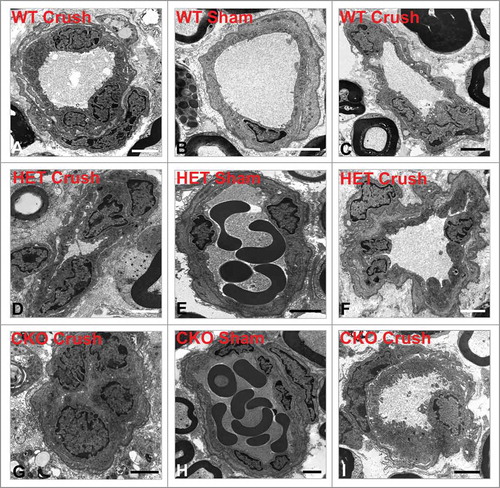
Figure 6. Quantitative effect of GDNF on sciatic nerve endoneurial microvessel HRP permeability on day 14 following crush injury. Bar histograms of mean % HRP-permeable endoneurial microvessels day 14 following sciatic nerve crush injury show no significant differences in HRP permeability in GDNF WT (blue histograms) and HET(green histograms) mice, with a significant difference observed in CKO (red histograms) mice compared to their contralateral Sham surgery controls (purple histograms) for each genotype (A). Significant reductions in % permeable microvessels were seen in WT and HET mice relative to CKO mice, with no differences between the former two genotypes (B). These data imply GDNF plays a significant role in facilitating complete restrictive BNB recovery 14 days after crush injury relative to baseline macromolecular permeability seen in Sham surgery control nerves. N = 12 mice, with 151 microvessels evaluated. **indicates p < 0.01, ****indicates p < 0.0001 and N.S. indicates not significant. Upper indicators in the comparison bar in B indicate significance relative to Sham controls, while lower indicators indicate significance relative to CKO.
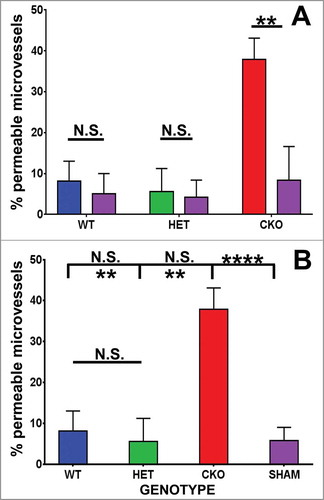
Figure 7. Qualitative effect of GDNF on sciatic nerve morphology on day 14 following crush injury. Representative digital light photomicrographs from the sciatic nerves of experimental mice 14 days following sciatic nerve crush injury at low (A, E, H) and high magnification (B, D, F, I) show a completely regenerated nerve segment in a GDNF WT mouse (A, B). Increased axonal density with clusters of numerous thinly myelinated regenerating axons (black arrows) are seen in another GDNF WT (D) and a HET (E, F) mouse compared to CKO mice (H, I) which is consistent with previous reports demonstrating a supportive role for GDNF in peripheral axonal regeneration following injury. Intact appearing endoneurial microvessels (white arrows) are shown in the regenerating WT (D) and HET (F) mouse sciatic nerves at higher magnification. Uninjured Sham surgery control nerves (C, G, J) from these mice are also shown. Scale bars = 50 µm (B, C, D, F, G, I, J) and 200 µm (A, E, H).
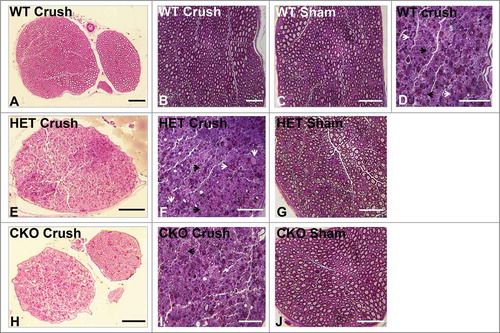
Figure 8. Qualitative effect of GDNF on sciatic nerve endoneurial microvessel HRP permeability on day 7 following crush injury. Representative digital ultramicrographs from the sciatic nerves of experimental mice 14 days following crush injury show HRP-impermeable endoneurial microvessels in GDNF WT (A) and HET (D) mice with a HRP-permeable endoneurial microvessel in a CKO mouse (G). HRP-impermeable endoneurial microvessels are seen in Sham control nerves for all genotypes (B, E, H). As observed at day 7, less frequent HRP-permeable endoneurial microvessels are seen in WT (C) and HET (F) crush-injured nerves, with HRP-impermeable endoneurial microvessels less commonly observed in CKO crush-injured nerves (I) compared to WT and HET mice that had equivalent numbers to Sham controls. Scale bars = 2 µm apart from (B) 1 µm.
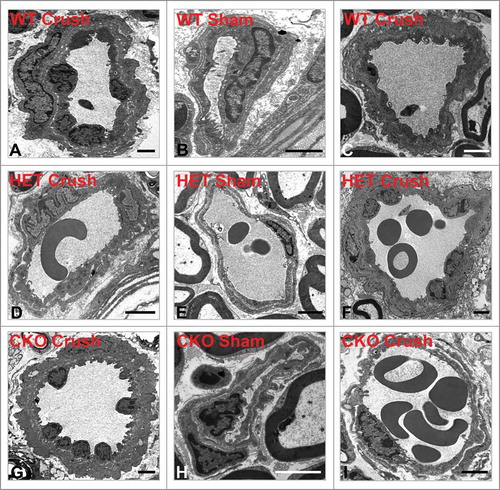
Figure 9. Quantitative expression of VE-Cadherin and claudin-5 during the immediate acute and recovery phases following crush injury. Bar histograms of mean % of CD31+ endoneurial microvessels expressing VE-Cadherin and claudin-5 on days 0, 7 and 14 following sciatic nerve crush injury show no differences between crush-injured GDNF WT (blue histograms), HET (green histograms) and CKO (red histograms) nerves and their Sham surgery control (purple histograms) nerves, or differences in expression between GDNF WT, HET and CKO mice at the different time points studied. These data imply that neither VE-Cadherin nor claudin-5 regulation is associated with the initial injury or the observed GDNF-mediated restoration in BNB macromolecular permeability function following non-transecting sciatic nerve crush injury in mice. N = 12 mice per time point, and N.S. indicates not significant.
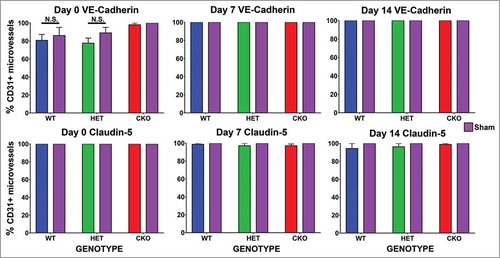
Figure 10. Qualitative expression of VE-Cadherin on endoneurial microvessels in GDNF WT, HET and CKO mice within 3 hours following crush injury. Representative digital photomicrographs from the sciatic nerves of experimental mice within three hours following crush injury (day 0) at low magnification to demonstrate most of the nerve show endoneurial microvessels (green; A, E and I) that are VE-Cadherin positive (red; B, F and J) in crush-injured nerves, further shown with merged images (yellow; C, G and K). An equivalent % is seen in Sham surgery control nerves (yellow; D, H and L). Examples of VE-Cadherin positive endoneurial microvessels are demonstrated by the single white arrows. VE-Cadherin expression is also observed in the perineurium (double white arrows) and endoneurial cells with Schwann cell profiles and distribution (white asterisk). Nuclei are depicted in blue. Scale bars = 100 µm, apart from L (50 µm).
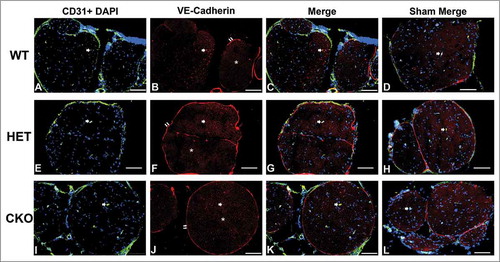
Figure 11. Qualitative expression of VE-Cadherin on endoneurial microvessels in GDNF WT, HET and CKO mice on day 7 following crush injury. Representative digital photomicrographs from the sciatic nerves of experimental mice on day 7 following crush injury at low magnification to demonstrate most of the nerve show endoneurial microvessels (green; A, E and I) that are VE-Cadherin positive (red; B, F and J) in crush-injured nerves, further shown with merged images (yellow; C, G and K). An equivalent % is seen in Sham surgery control nerves (yellow; D, H and L). Examples of VE-Cadherin positive endoneurial microvessels are demonstrated by the single white arrows. VE-Cadherin expression is also observed in the perineurium (double white arrows) and endoneurial cells with Schwann cell profiles and distribution (white asterisk). Nuclei are depicted in blue. Scale bars = 100 µm.
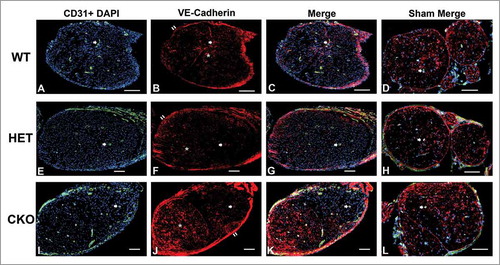
Figure 12. Qualitative expression of VE-Cadherin on endoneurial microvessels in GDNF WT, HET and CKO mice on day 14 following crush injury. Representative digital photomicrographs from the sciatic nerves of experimental mice on day 7 following crush injury at low magnification to demonstrate most of the nerve show endoneurial microvessels (green; A, E and I) that are VE-Cadherin positive (red; B, F and J) in crush-injured nerves, further shown with merged images (yellow; C, G and K). An equivalent % is seen in Sham surgery control nerves (yellow; D, H and L). Examples of VE-Cadherin positive endoneurial microvessels are demonstrated by the single white arrows. VE-Cadherin expression is also observed in the perineurium (double white arrows) and endoneurial cells with Schwann cell profiles and distribution (white asterisk). Nuclei are depicted in blue. Scale bars = 100 µm.
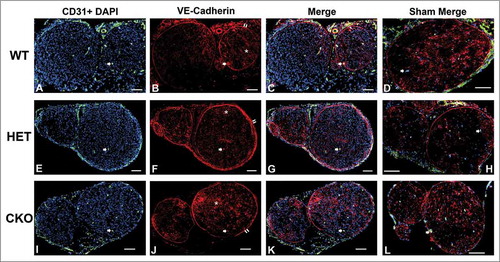
Figure 13. Qualitative expression of claudin-5 on endoneurial microvessels in GDNF WT, HET and CKO mice within 3 hours following crush injury. Representative digital photomicrographs from the sciatic nerves of experimental mice within three hours following crush injury (day 0) at low magnification to demonstrate most of the nerve show endoneurial microvessels (green; A, E and I) that are claudin-5 positive (red; B, F and J) in crush-injured nerves, further shown with merged images (yellow; C, G and K). An equivalent % is seen in Sham surgery control nerves (yellow; D, H and L). Examples of claudin-5 positive endoneurial microvessels are demonstrated by the white arrows. Scale bars = 500 µm.
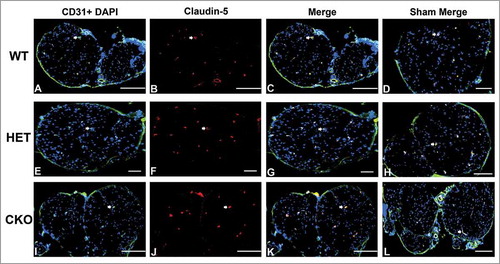
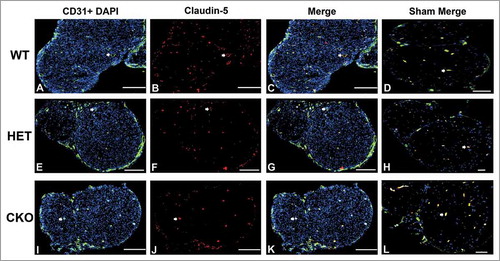
Figure 14. Qualitative expression of claudin-5 on endoneurial microvessels in GDNF WT, HET and CKO mice on day 7 following crush injury. Representative digital photomicrographs from the sciatic nerves of experimental mice on day 7 following crush injury at low magnification to demonstrate most of the nerve show endoneurial microvessels (green; A, E and I) that are claudin-5 positive (red; B, F and J) in crush-injured nerves, further shown with merged images (yellow; C, G and K). An equivalent % is seen in Sham surgery control nerves (yellow; D, H and L). Examples of claudin-5 positive endoneurial microvessels are demonstrated by the white arrows. Scale bars = 500 µm, apart from A-C and H (200 µm).
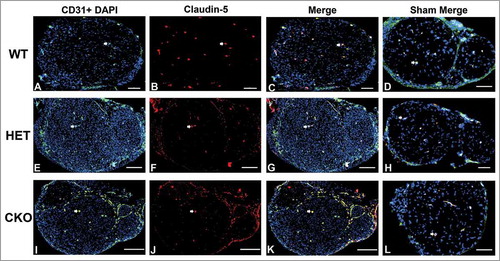
Figure 15. Qualitative expression of claudin-5 on endoneurial microvessels in GDNF WT, HET and CKO mice on day 14 following crush injury. Representative digital photomicrographs from the sciatic nerves of experimental mice on day 14 following crush injury at low magnification to demonstrate most of the nerve show endoneurial microvessels (green; A, E and I) that are claudin-5 positive (red; B, F and J) in crush-injured nerves, further shown with merged images (yellow; C, G and K). An equivalent % is seen in Sham surgery control nerves (yellow; D, H and L). Examples of claudin-5 positive endoneurial microvessels are demonstrated by the white arrows. Scale bars = 500 µm, apart from D (200 µm), H (100 µm) and L (1000 µm).