Figures & data
Figure 1. Epithelial identity pathways and experimental design. (a) Tight junction and signal transduction pathways regulating epithelial permeability. (b) Permeable membrane culture system and TEER electrical diagram. (c) Experimental timeline.
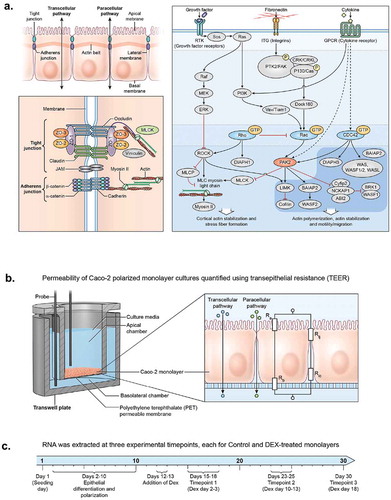
Figure 2. Days 1 – Day 30 Caco-2 Timecourse, Cellular Aging Experiment. (a) Histogram of sample numbers by timepoint. (b) Heatmap of pathway scores, using ReactomeDB pathway annotations. (c) Volcano plots showing differentially expressed genes by pathway annotation for significant pathways identified in gene-set analysis.
Figure 2. (Continued).
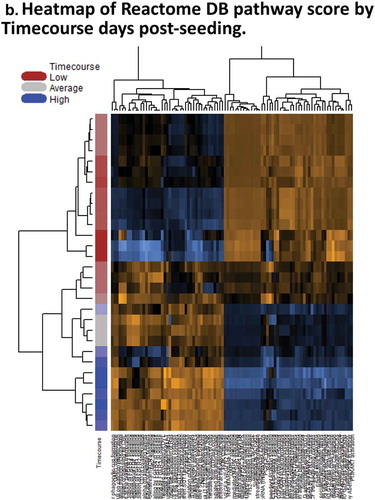
Figure 2. (Continued).
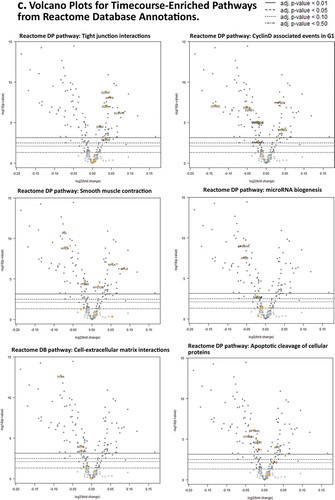
Figure 3. Dexamethasone vs. Controls Timecourse. (a) Confocal image of a representative Caco-2 polarized monolayer at ~10 days with immunofluorescent staining for Occludin (OCLN) and ZO-1 (TJP). (b) TEER (ohms/cm2) for DEX and Control samples during the timecourse. (c) Sample distributions used in DEX vs Control analysis by days post-seeding. (d) Unsupervised clustering of relative gene expression in the full probe panel. (e) PCA results showing PC1 is reasonable predictor for timecourse, PC3 is a marginally effective predictor for DEX treatment.
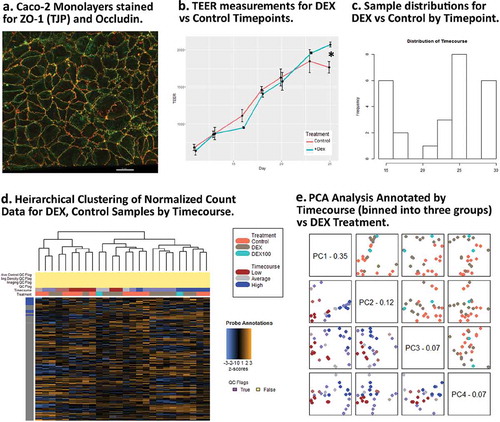
Figure 4. Dexamethasone vs. Controls Timecourse. (a) Volcano plots for covariates under our GLM-based modeling strategy. (b) Clustering of raw pathway scores. (c) Clustering of differential pathway scores for each experimental comparison.
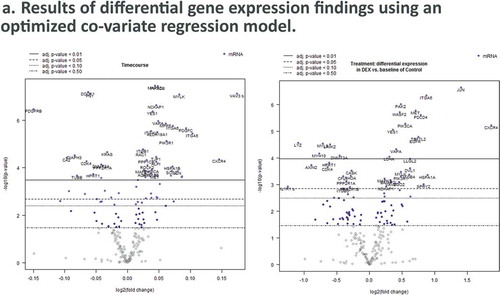
Figure 4. (Continued).
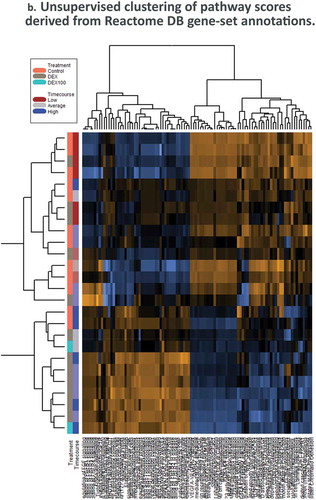
Figure 4. (Continued).
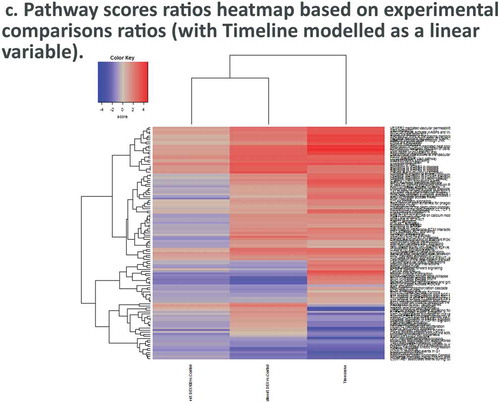
Figure 5. Pathway score and GSA results for Dexamethasone vs. Controls Timecourse. (a),(c). Expression of genes associated with RHO GTPases Activate ROCKs ReactomeDB pathway show activity associated with DEX treatment. (b),(d) Expression of genes associated with Apoptotic cleavage of cellular proteins pathway shows activity associated with timecourse, but not with DEX treatments.
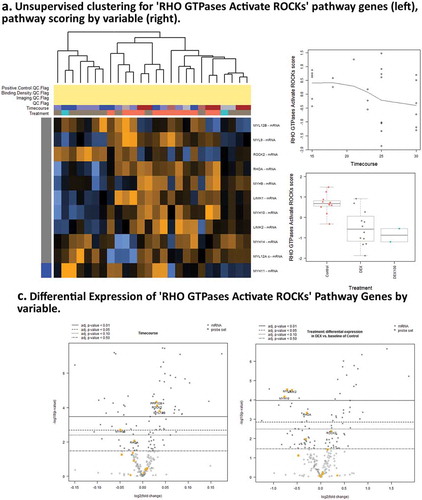
Figure 5. (Continued).
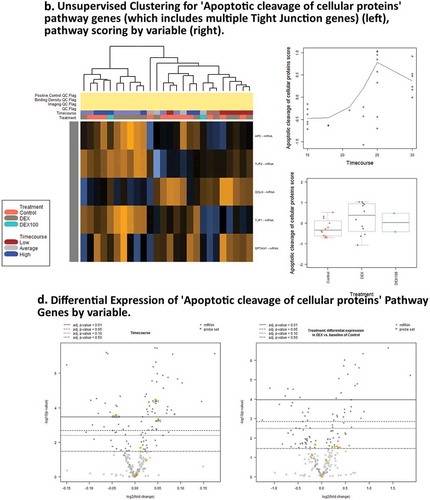
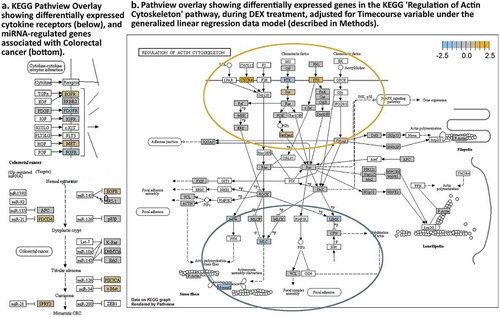
Figure 6. KEGG Pathview readouts of DEX vs Control-associated differential gene expression. (a) Differentially expressed cytokine receptors and known miRNA targets in colorectal cancer. (b). KEGG pathway map “Regulation of Actin Cytoskeleton” shows the effects of DEX treatment. (white boxes – not tested).