Figures & data
Figure 1. Antigens for anti-ZO-1 antibodies.
Schematic diagrams of human (a) and mouse (b) ZO-1, with numbers indicating the position of different structural domains along the respective sequences. Continuous black lines indicate antigens used for the production of the respective antibodies ((a): 33–9100, 61–7300; (b) R40.76 and R3). The dashed line in (b) indicates that the localization of the mouse ZO-1 epitope recognized by R40.76 is not known.
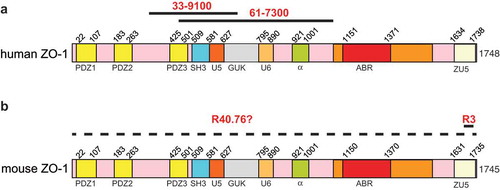
Figure 2. The rat monoclonal R40.76 and the rabbit polyclonal R3 bind to the α and ZU5 domains of ZO-1, respectively.
(a). Schematic diagrams of mouse and human ZO-1 constructs expressed in HEK cells, used for the mapping of antibody epitopes. The N-terminal tags, either GFP or myc, the amino-acid residues of ZO-1 included in each construct, and the presence or absence of the α domain (α+) or (α-) are indicated. (b). Antibody R40.76 binds to the α domain. Immunoblotting analysis of HEK cell lysates expressing the mouse ZO-1 constructs. FL, N-term and C-term constructs, the presence (+) or absence (-) of the α domain, and amino-acid residues of each construct are indicated on top. Numbers on the left indicate the migration of pre-stained molecular weight markers (kDa). Antibodies used for IB are indicated on the right. Antibodies against β-tubulin were used to normalize lysates. (c). Antibody R3 binds to the ZU5 domain. Immunoblotting analysis of HEK cell lysates expressing the human FL, ΔZU5, and ZU5 constructs, using antibodies against ZO-1 (R3) and GFP and myc tags. (d). Schematic diagram summarizing experimentally determined the reactivity of antibodies against indicated regions/constructs of mouse ZO-1 (green lines above the scheme), and position of antigens (black lines below the scheme)
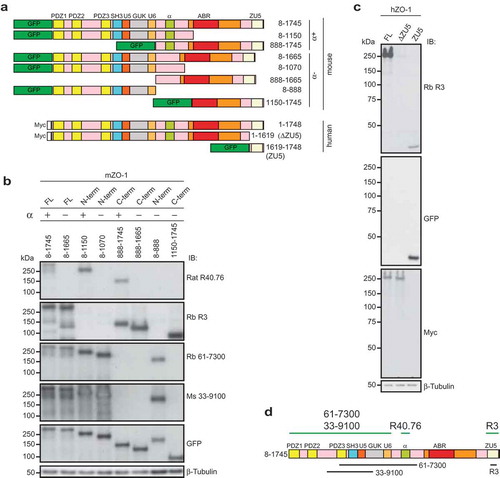
Figure 3. The α and ZU5 domains of ZO-1 are not required for the junctional localization of ZO-1.
(a–b). Immunofluorescent analysis of ZO-1-KO Eph4 cells, using either R40.76 (a) or R3 (B) antibodies, after transfection of ZO-1-KO cells either with GFP-tagged mouse constructs either with or without the α domain (a), or with myc-tagged human ZO-1 constructs either with or without the ZU5 domain (b). Control cells (bottom row) were transfected with GFP-myc alone, which was labeled with antibodies against either GFP (A, second column), or myc (B, second column). Arrows indicate junctional localization, arrowheads indicate undetectable labeling at junctions that contain the zonula adhaerens protein PLEKHA7 (A and B, 4th column), used as a reference junction marker. Merge images are shown in the third column (A, B, third column), with nuclei labeled by DAPI. Scale bar = 10 μm. Exogenous ZO-1 lacking the α domain is localized at junctions but is not labeled by R40.76, and exogenous ZO-1 lacking the ZU5 domain is localized at junctions but is not labeled by R3.
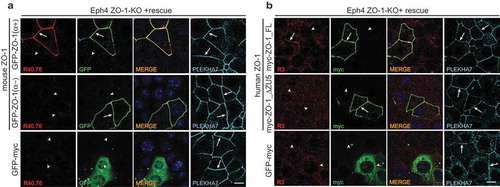
Figure 4. Increased expression of the ZO-1 (α+) isoform correlates with epithelial differentiation.
(a). Immunoblotting analysis of lysates from the indicated cell lines, using antibodies against ZO-1 indicated on the right. (b) Quantification or relative expression of (α+) and (α-) IB signals in the indicated cell lines, following densitometric analysis (Materials and Methods). (c) Immunoblotting analysis of lysates from primary mouse keratinocytes either from WT or CGN-KO cells, either cultured in the absence of 1.2 mM calcium chloride (-), or after calcium-induced differentiation (+), using antibodies indicated on the right. Anti-cingulin antibody (C532) was used to verify genotype. Lysates of mouse mCCD cells were used as a control for the migration and expression of the two ZO-1 isoforms. (d). Quantification of relative expression of (α+) and (α-) in mouse primary keratinocytes, and mCCD cells, based on densitometric analysis of the data shown in (c).