Figures & data
Figure 1. Morphological diversity of tight junction spikes. (a) AECs isolated from Sprague Dawley rats were cultured on collagen-coated coverslips for 6 d. The cells were then fixed, permeabilized, immunolabeled for claudin-18 and analyzed by stimulated emission depletion (STED) super-resolution microscopy, Bar: 2.5 µm. Images are representative of n = 14 fields collected from three coverslips from N = 2 biological replicates. (b) Diagram showing different morphological profiles of tight junction spikes observed by immunofluorescence. (c) Live-cell imaging of AECs expressing EYFP-cldn-18 showing two examples of tight junction spikes increasing in length over a 30-min period of observation (arrows). Bar: 2.5 µm
Figure 2. Distribution of claudin-18 and ZO-1 differs along length of tight junction spikes. (a) AECs isolated from control and alcohol-fed Sprague Dawley rats were cultured on collagen-coated coverslips for 6 d. The cells were then fixed, permeabilized, immunolabeled for ZO-1 (red) and claudin-18 (cyan), and analyzed by stimulated emission depletion (STED) super-resolution microscopy. Shown is an example of an individual tight junction spike. Bar: 1 µm. (b) Line scans of the image in (a) show differential distribution of ZO-1 and claudin-18. (c,d) Aggregate intensity data of claudin-18 (c) and ZO-1 (d) calculated as mean ± SD from control AECs (2 biological replicates, 84 spikes) and alcohol-exposed AECs (2 biological replicates, 92 spikes). Trend lines show claudin-18 intensity increased with spike projection length for control AECs and decreased for alcohol-exposed AECs (**p = .0014, simple linear regression with slope comparison);, however, ZO-1 intensity decreased for both classes of AECs (ns – not significant, simple linear regression with slope comparison). (e, f) The claudin-18/ZO-1 ratio increased for spikes in control AEC (** p = .0016, one-way ANOVA with Tukey’s test of multiple comparisons) but not for alcohol-exposed AECs (ns – not significant). (g) The claudin-18/ZO-1 ratio at 7 µm was higher for spikes from control AECs (n = 22) vs alcohol exposed AECs (n = 43) (* p = .021, unpaired two-tailed t-test). (h) The average length of alcohol spikes was longer compared to control spikes, as determined by ZO-1 immunofluorescence. Images are representative of n = 178 spikes imaged across 14 fields from three coverslips from N = 2 biological replicates
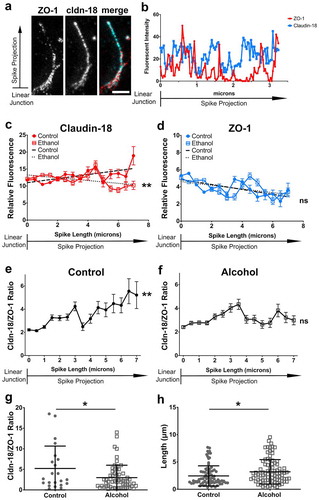
Figure 3. Claudin-5 induced paracellular leak is localized. (a–e) AECs isolated from Sprague Dawley rats were cultured on biotinylated gelatin-coated coverslips for 6 d. The live cells were then incubated with FITC-avidin (cyan) for 5 minutes, then fixed and immunolabeled for ZO-1 (red). Two different examples of fields are shown in (a, b). Line scans of representative areas containing a linear tight junction (c), a tight junction spike (d) or a localized area with increased permeability (e) are shown where the blue line represents FITC-avidin and the red line represents ZO-1. Dashed lines in merged images denote where line scans were taken. (f) AECs were cultured on biotinylated gelatin-coated coverslips and transduced at d 2 with claudin-5 (AdCldn-5) at MOI = 25 . AECs were further cultured for a total of 6 d before labeling with FITC-avidin and ZO-1, which revealed several areas of enhanced FITC-avidin permeability. A line scan of an area with enhanced permeability is shown in (g). (h) AdCldn-5 transduced cells were significantly more permeable to FITC-avidin as compared with untreated AECs (* p = .015, unpaired two-tailed t-test). Images are representative of n = 26 control fields and 26 AdCldn-5 fields collected from N = 4 individual coverslips. Bars: 10 µm
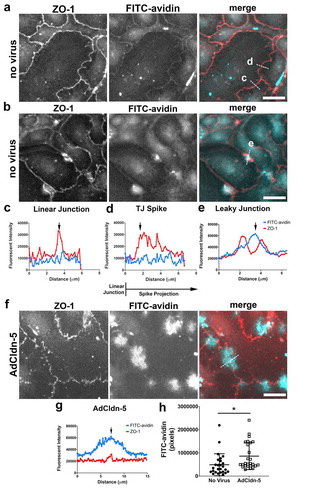
Figure 4. Asymmetric localization of β-catenin relative to tight junction spikes. (a) AECs isolated from control Sprague Dawley rats were cultured on collagen-coated coverslips for 6 d. The cells were then fixed, permeabilized, immunolabeled for β-catenin (red) and ZO-1 (cyan) and imaged by immunofluorescence microscopy. The majority of β-catenin preferentially localized to areas opposed to sites containing tight junction spikes. Squares indicate magnified areas. Most β-catenin localized at the opposing side of tight junction spikes at bicellular junctions (arrows), but some β-catenin localized adjacent to tight junction spikes (arrowheads). There was occasional β-catenin localized at or near the ends of tight junction spikes, but most spikes did not contain β-catenin. (b) The number of regions containing β-catenin opposed to tight junction spikes was significantly higher than the number of β-catenin regions coincident with tight junction spikes (**** p < .0001; 5 biological replicates, n = 751 regions of interest; unpaired two-tailed t-test, average ± SD). (c) β-catenin (red) predominantly localized opposite to spike-associated Claudin-18 (cyan) (arrows) and occasionally adjacent to Claudin-18 (arrowheads). Images are representative of four independent experiments. Bars: 10 µm
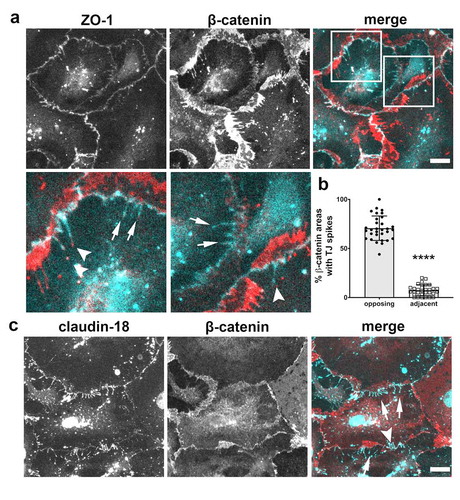
Figure 5. Localization of β-catenin and ZO-1 relative to actin stress fibers. (a) AECs isolated from Sprague Dawley rats were cultured on collagen-coated coverslips for 6 d. The cells were then fixed, permeabilized, and immunolabeled for β-catenin (cyan) and actin (red). Squares show position of magnified regions below. Arrows indicate β-catenin at intercellular linear junctions. Actin filaments appear to terminate in regions containing high levels of β-catenin (arrowheads). (b) AECs double labeled with ZO-1 (cyan) and actin (red) show tight junction spikes aligning along actin filaments (arrowheads) distinct from ZO-1 at linear intercellular junctions (arrows). Images are representative from three independent experiments. Bars: 10 µm
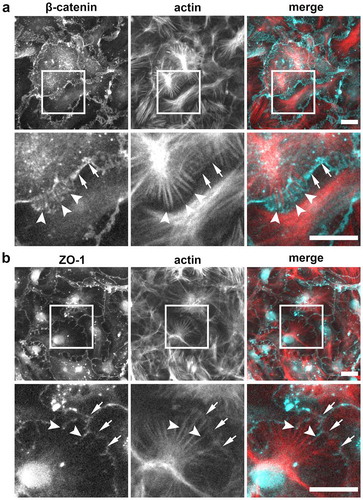
Figure 6. Lateral organization of ZO-1 above β-catenin revealed by 3D structured illumination microscopy. (a) AECs isolated from Sprague Dawley rats were cultured on collagen-coated coverslips for 6 d. The cells were then fixed, permeabilized, and immunolabeled for β-catenin (red) and ZO-1 (cyan). Individual slices from z-stacks using 3D structured illumination microscopy (SIM) revealed z-stack separated tight junctions and adherens junctions at asymmetrical β-catenin areas between overlapping AECs. Numbers in (a) represent distance from the top of the cells. (b) 3D volume images of the reconstructed z-stack slices were rotated along the x-axis to show the z-separation of ZO-1 and β-catenin. Bars: 5 µm
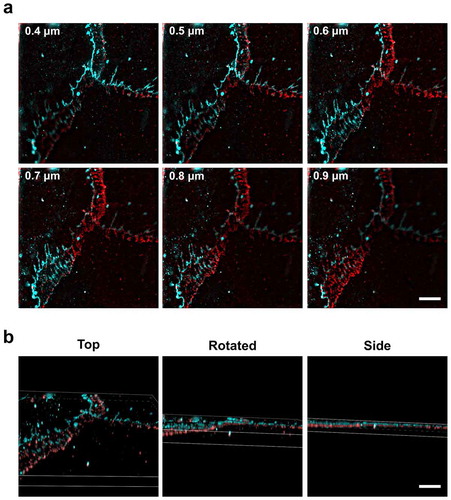
Figure 7. Dynamin-2 localizes to tight junctions. (a, b) AECs isolated from Sprague Dawley rats were cultured on collagen-coated Transwell permeable supports for 6 d and then collected as protein lysates for immunoblot analysis (n = 3 biological replicates). ** p = .004, one-way ANOVA with Tukey’s test of multiple comparisons, average ± SD. (c,d) AECs on collagen-coated coverslips were fixed and immunolabeled for (c) ZO-1 (red) and dynamin-2 (cyan) or (d) β-catenin (red) and dynamin-2 (cyan). (e) AECs transduced with EYFP-claudin-18 (red) at MOI 25 on d 2 were fixed and immunolabeled for dynamin-2 (cyan). Dashed lines in (c–e) merged images denote where line scans were taken. Dynamin-2 showed sharp localization with tight junctions, (arrows), but only partially localized with β-catenin (d). Images are representative from three independent experiments
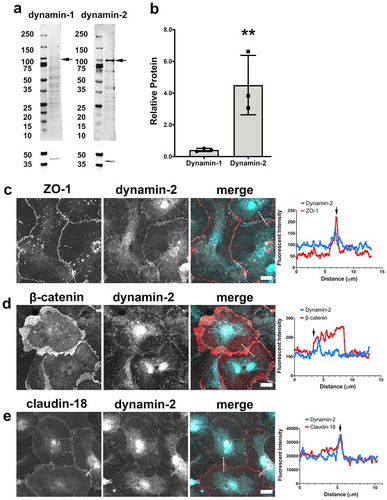
Figure 8. Differential effects of dynamin inhibitors on spike formation, length and actin. (a) AECs isolated from Sprague Dawley rats were cultured on collagen-coated coverslips for 6 d. The cells were then treated with vehicle control, Dynasore (160 µM, 4 h), Dynole 34–2 (10 µM, 2 h), or MiTMAB (30 µM, 2 h), then fixed and triple labeled with AlexaFluor405-phalloidin (actin, red), β-catenin (cyan), and ZO-1 (white). (b, c) The inhibitors differentially affected the number of tight junction spikes and average spike length as determined by ZO-1 immunofluorescence, comparing control AECs (5 biological replicates, 9494 total spikes) with AECs treated with either Dynasore (2 biological replicates, 365 total spikes), Dynole 34–2 (2 biological replicates, 6928 total spikes), or MiTMAB (2 biological replicates, 5185 total spikes). * p = .021, # p = .012, two-way ANOVA with Tukey’s test of multiple comparisons, average ± SD. Images are representative of n = 6 fields from two independent experiments. Bars: 10 µm
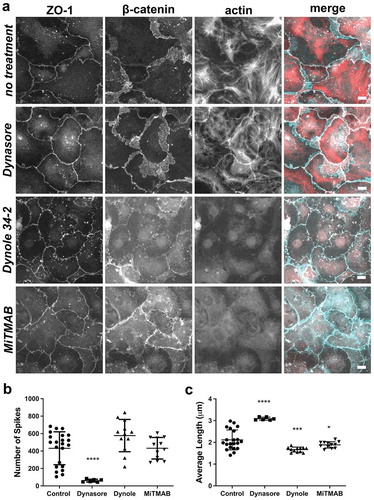
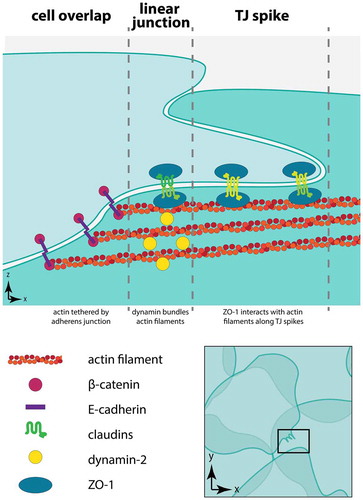
Figure 9. Organization of dynamin, actin, and junctions at tight junction spikes. This model represents three regions in squamous rat alveolar epithelial cells present near tight junction spikes. The region of overlap between neighboring cells is depicted with adherens junctions tethering actin filaments at cell–cell junctions. Dynamin localized to linear tight junctions bundles actin filaments, facilitating interactions with ZO-1 to enable formation of tight junction spikes