Figures & data
Figure 1. Schematic representation of animal design. Male C57BL/6 mice (n = 25) were fed with chow or high fat diet for 15 weeks. Obese and lean mice were then administered either adipose-derived mesenchymal stem cells (ASCs) or vehicle (media) on week 15 and week 25. A group of mice was left on HFD for 31 weeks. n = 5 for each group
Figure 2. Adipose-derived mesenchymal stem cells attenuate epididymal adipose tissue expansion in HFD-induced obese mice. Representative images of hematoxylin and eosin (H&E)-stained sections (a) and weight (b) of epididymal adipose tissue. Adipocyte area was also quantified (c). n = 5. *** represents statistical significance between groups at P < .001
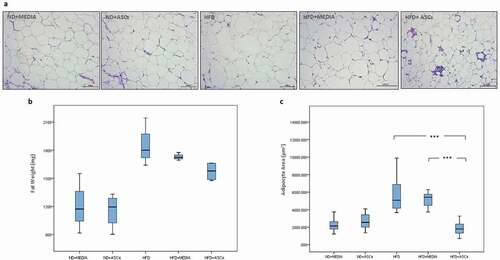
Figure 3. Adipose-derived mesenchymal stem cells reverse liver enlargement induced by HFD feeding in C57BL/6 mice. (a) Gross morphology and (b) weight of the liver in treated mice groups. Data are presented as mean ± SEM; n = 5. *** represents statistical significance between groups at P < .001
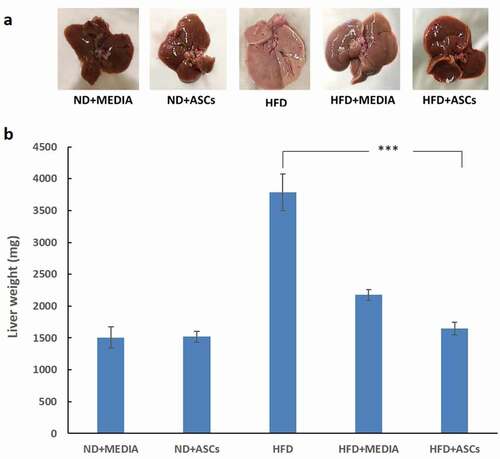
Figure 4. Adipose-derived mesenchymal stem cells suppress liver steatosis and hepatocyte ballooning induced by HFD in mice. (a) Representative images of Hematoxylin/eosin (H&E) and Masson’s Trichrome (MT)-stained liver sections obtained from treated groups and (b) quantification of lipid droplet numbers. Data are presented as mean ± SEM. *** represents statistical significance between groups at P < .001
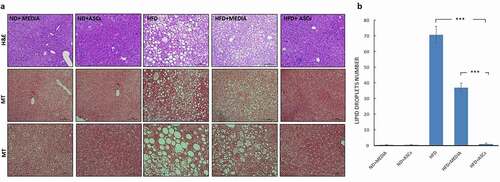
Figure 5. Adipose-derived mesenchymal stem cells decrease glomerular swelling observed in the kidneys of HFD-fed mice. (a) Representative images of Hematoxylin/eosin (H&E), periodic acid-Schiff (PAS) and Masson’s Trichrome (MT)-stained kidney sections obtained from different animal groups. (b) Kidney weight, (c) glomerular tuft area and d) % of glomerular fibrosis were also quantified. Data are presented as mean ± SEM. ** and *** represent statistical difference between groups at P < .01 and P < .001 significance, respectively
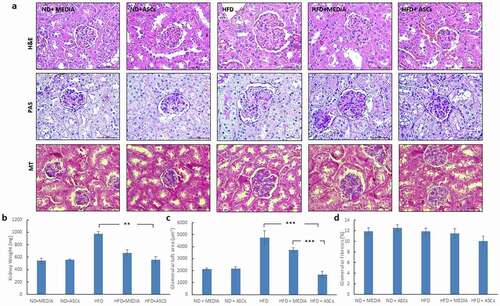
Figure 6. Adipose-derived mesenchymal stem cells attenuate cardiomyocyte hypertrophy induced by HFD in mice. (a) Representative images of transverse (upper panel) and longitudinal (middle and lower panels) cardiac muscle tissue sections from different animal groups stained with Hematoxylin/eosin (H&E) and Masson’s Trichrome (MT) stains. (b) Heart weight and (c) cardiomyocyte area were also quantified. Data are presented as mean ± SEM. *** represents statistical significance between groups at P < .001
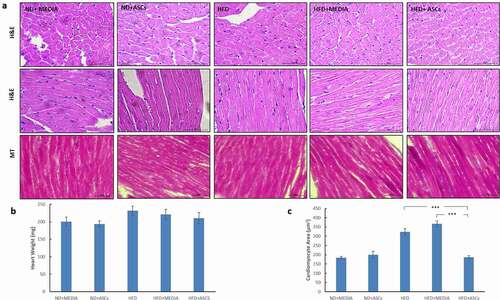
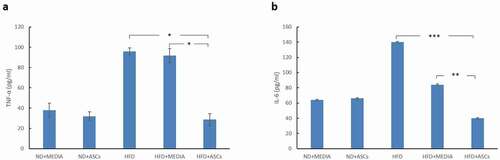
Figure 7. Adipose-derived mesenchymal stem cells treatment suppresses TNF-α and IL-6 expression in the serum of HFD-fed mice. ELISA analyses of TNF-α (a) and IL-6 (b) expression in various animal groups. *, **, and *** represent statistical difference between groups at P < .05, P < .01 and P < .001 significance, respectively