Figures & data
Figure 1. Desmoplakin architecture changes as desmosome mature. (a) Images of desmosomes (MDCK cells labeled for desmoplakin rod/C-terminal domain) illustrating the improved resolution of direct stochastic optical reconstruction microscopy (dSTORM) compared to widefield microscopy. The region of interest shows a single desmosome and illustrates the measurements obtained from dSTORM images. The plaque-to-plaque distance is quantified as illustrated in the plot of fluorescence intensity as a function of distance for a line scan through the desmosome. Scale bar = 0.5 μm. (b-d) MDCK cells were stained for the desmoplakin rod/C-term junction following Ca2+ switch for 3, 6, 8, 12, and 36 h as indicated. (b) Representative dSTORM images of cell-cell borders at each timepoint. (c) Plaque-to-plaque distance and (d) plaque length at each timepoint (mean ± SD; datapoints are individual desmosomes). (e) HUC dSTORM images at 3 and 12 h, (f) plaque-to-plaque distance, and (g) plaque length at each timepoint (mean ± SD). (e) NHEK dSTORM images at 3 and 12 h, (f) plaque-to-plaque distance, and (g) plaque length at each timepoint (mean ± SD). (b, e and h) Scale bars = 1 μm. (ns, not significant, * P ≤ .05, ** P ≤ .01, *** P ≤ .001, and **** P ≤ .0001 by (c, d) ANOVA with post hoc Tukey’s test or f, g, i and j) Student’s t-test. (c and d) (MDCK 3 h n = 16, 6 h n = 19, 8 h n = 19, 12 h n = 37, and 36 h n = 23) and (f and g) (HUC 3 h n = 16 and 12 h n = 16); and (i and j) (NHEK 3 h n = 13 and 6 h n = 31). Experiments were performed in triplicate.
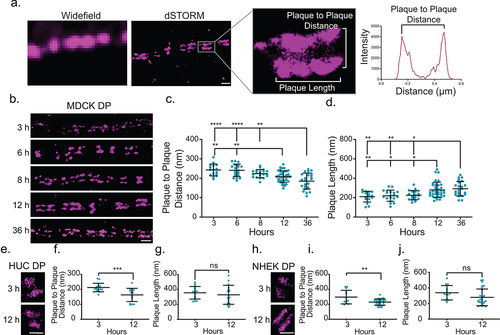
Figure 2. Desmoplakin architecture changes are due to rearrangement of the rod domain. (a) Schematic of protein arrangement in desmosomes and where the antibodies utilized in this study bind. (b-d) MDCK cells were stained for plakoglobin (PG) following Ca2+ switch 3, 6, 8, 12, or 36 h as indicated. (b) Representative dSTORM images, (c) plaque-to-plaque distance, and (d) plaque length. (e-g) MDCK cells were stained for desmoplakin N-terminal domain (DP N-term) 3 or 12 h following Ca2+ switch. (e) Representative dSTORM images, (f) plaque-to-plaque distance, and (g) plaque length. Scale bars = 0.25 μm. (mean ± SD ns not significant, * P ≤ .05, ** P ≤ .01, and *** P ≤ .001 by (c and d) ANOVA with post hoc Tukey’s test or (f and g) Student’s t-test). (b-d)(PG 3 h n = 18, 6 h n = 16, 8 h n = 10, 12 h n = 15, and 36 h n = 25) (e-g) (DP N-term 3 h n = 15 and 12 h n = 38) Experiments were performed in triplicate.
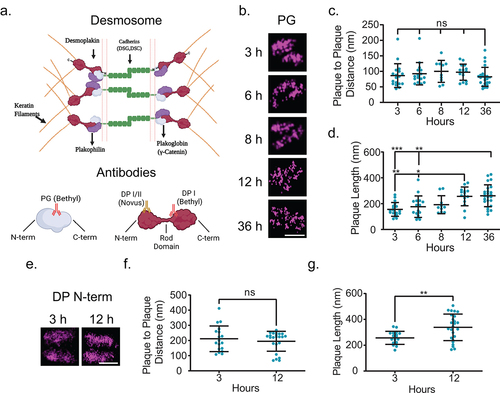
Figure 3. E-cadherin is excluded from the mature junction and adhesive function is increased. (a) Example of E-cadherin enrichment analysis. Line scans through at least three desmosomes (indicated by desmoplakin) are performed. If an E-cadherin intensity peak overlaps a desmoplakin intensity peak, as in the first panel, it is considered enrichment, while if a desmoplakin intensity peak does not overlap with a corresponding E-cadherin intensity peak, as in the second panel, it is considered excluded. (b) Representitive images of MDCK cells labeled for desmoplakin (magenta) and E-cadherin (cyan). (c) Quantification of E-cadherin enrichment (3 h n = 21, 6 h n = 21, 8 h n = 21, 12 h n = 21, and 36 h n = 21). (d) Representative images of HUCs and (e) quantification of E-cadherin enrichment (3 h n = 30 and 12 h n = 30). (f) Representative images of NHEKs (g) and quantification of E-cadherin enrichment (3 h n = 15 and 12 h n = 38) (b-g, experiments performed in triplicate.) (h-j) Quantification of dispase fragmentation assay at different time points after Ca2+ switch (mean ± sem) in (h) MDCK, (i) HUC, or (j) NHEK cells. (h) Single MDCK cells were counted using a hemocytometer and (i and j) HUC and NHEK fragments were counted manually under a dissecting microscope. n = 5 wells/timepoint, experiment performed in triplicate. Scale bar = 5 μm. * P ≤ .05, ** P ≤ .01, *** P ≤ .001, and **** P ≤.0001 by ANOVA with post hoc Tukey’s test.
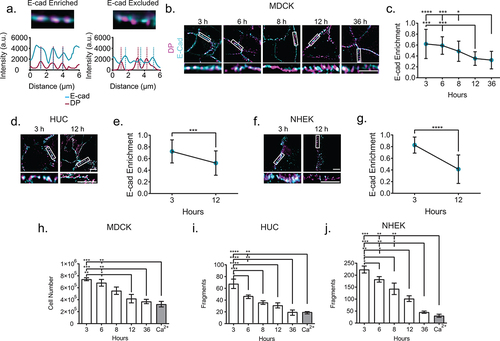
Figure 4. Desmosome architectural changes correspond to E-cadherin exclusion in individual junctions. (a) Representative two-color dSTORM images of desmosomes in MDCK cells over time (magenta: desmoplakin rod/C-terminal junction and cyan: E-cadherin). Quantification of the desmoplakin plaque-to-plaque distance (b) and plaque length (c) according to whether E-cadherin was present (cyan) or not (magenta). (3 h n = 25, 6 h n = 25, 8 h n = 25, 12 h n = 25, and 36 h n = 25) Scale bar = 0.5 μm. * P ≤ .05, ** P ≤ .01, and *** P ≤ .001 by ANOVA with post hoc Tukey’s test.
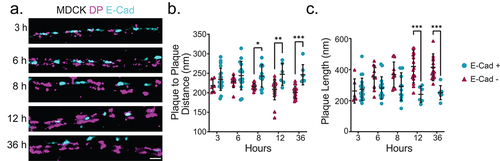
Figure 5. Changing architecture is consistent in migrating cells. (a) The left panel shows a representative RICM image of the scratch, the middle panel shows a two-color dSTORM image of desmosomes at the scratch (magenta: desmoplakin, cyan: E-cadherin), and the right panel shows the overlay of the RICM and dSTORM images. Desmosomes at the first half of the cells at the leading edge of the scratch are defined as Zone 1, the back half of the same cells are defined as Zone 2, and cells behind the leading edge are defined as Zone 3. (b) depicts a representative zoomed in the area of each Zone. (c) depicts a representative single desmosome from each corresponding zone. Quantification of plaque-to-plaque distance (d), plaque length (e), and percent E-cad-positive desmosomes (f) for each zone. (Zone I n = 16, Zone II n = 34, and Zone III n = 47). Scale bar = 5 μm (A) 0.25 μm (b,c). * P ≤ .05, ** P ≤ .01 by ANOVA with post hoc Tukey’s test.
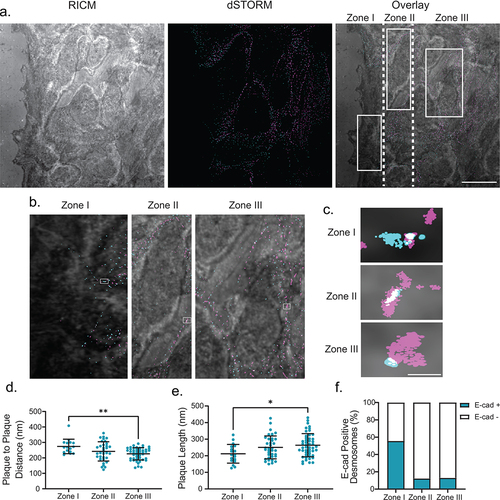
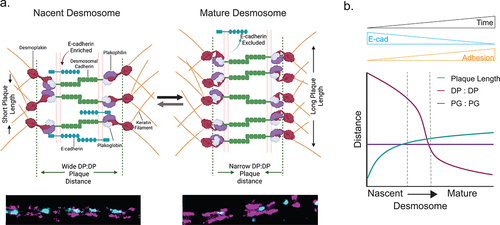
Figure 6. (a) Model illustrating architectural changes that take place during desmosome assembly and maturation. In nascent desmosomes, E-cadherin is enriched, desmosomes are shorter, and the desmoplakin rod/C-term plaque-to-plaque distance is wider compared to that in mature desmosomes where E-cadherin is excluded, the desmoplakin rod/C-terminal junction plaque-to-plaque distance is narrow, and the plaque length is extended. These structural changes may play important roles in the increased adhesion of mature desmosomes. (b) Schematic of the trends of the plaque length (green), desmoplakin plaque-to-plaque distance (magenta), and plakoglobin plaque-to-plaque distance (purple) as desmosomes mature.