Figures & data
Figure 1. Peptides utilized in experiments. Amino acid sequences of CPPs and cargo peptides (underlined) as well as conjugated cargo-CPP fusion peptides used in experiments. The associated abbreviations of the peptides are shown next to the displayed sequence. The RRKRK pentabasic docking site on eNOS is bolded.
Figure 2. eNOS:RRKRK-AP improves endothelial resistance. a) Transendothelial electrical resistance (TEER) of HMVECs treated with either eNOS:RRKRK-AP or AP 25 μM (or no peptide) 30 minutes prior to the addition of LPS (100 ng/ml) or vehicle control. All data is normalized to baseline resistance per condition prior to the addition of peptide treatments and recorded every hour. Arrows indicate the time of peptide and LPS (or control) given. b) Area under the curve (AUC) relative to the change from baseline resistance over time calculated for all conditions in the absence (left) or presence (right) of LPS addition for the entire 24 hours of data. * = p < .05 between designated groups. † = p< .05 between indicated group and no peptide.
Figure 3. AP protects against endothelial permeability and IL-6 production compared to TAT. a) TEER of HMVECs treated with 25 μM of eNOS:RRKRK-AP, scrambled-AP, or AP compared to 25 μM TAT (or no peptide) 30 minutes prior to the addition of LPS (100 ng/ml, right) or vehicle control (left). All data is normalized to baseline resistance per condition prior to the addition of peptide treatments and recorded every hour. Arrows indicate time of peptide and LPS (or control) given. b) Supernatant levels of IL-6 from peptide groups in A after 6 hours of LPS exposure (100 ng/ml). * = p < .05 between designated groups. † = p< .05 between indicated group and no peptide.
Figure 4. TAT-eNOS:RRKRK-TAT improves endothelial resistance without effects on cytokine production. a) TEER of HMVECs treated with either 25 μM TAT-eNOS:RRKRK-TAT or TAT-scrambled-TAT 30 minutes prior to the addition of LPS (100 ng/ml) or vehicle control. Data is normalized to baseline resistance per condition prior to the addition of peptide treatments and recorded every hour. Arrows indicate the time of peptide and LPS (or control) given. b) Area under the curve (AUC) of panel A relative to the change from baseline resistance over time calculated for all conditions in the absence or presence of LPS addition for the entire 24 hours of data. c) Supernatant levels of IL-6 and angiopoietin-2 (Ang-2) from peptide groups after 6 hours of LPS exposure (100 ng/ml). * = p < .05 between designated groups.
Figure 5. Prolonged TAT-eNOS:RRKRK-TAT exposure enhances endothelial resistance to late LPS. a) TEER of HMVECs treated with either 25 μM TAT-eNOS:RRKRK-TAT or TAT-scrambled-TAT 48 hours prior to the addition of LPS (100 ng/ml), then followed 24 hours after LPS exposure. Data is normalized to baseline resistance per condition prior to the addition of peptide treatments and recorded every hour. Arrows indicate the time of peptide and LPS given. b) Area under the curve relative to the change from baseline (prior to peptide exposure) over time calculated for all conditions in the first 48 hours after peptide exposure (top), 24 hours after LPS exposure (bottom) and duration of the entire 72 hours (right). * = p < .05 between designated groups. † = p< .05 between indicated group and no peptide.
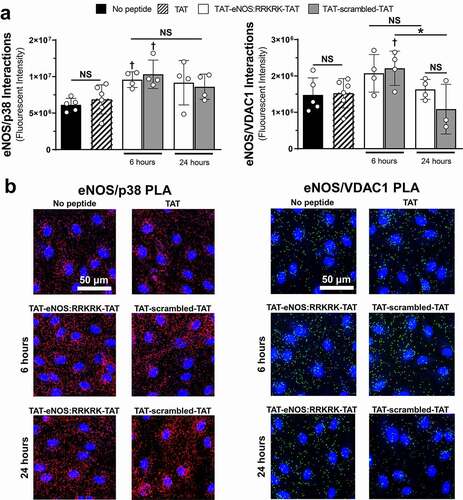
Figure 6. TAT-eNOS:RRKRK-TAT and TAT-scrambled-TAT peptides do not significantly alter eNOS protein–protein interactions compared to one another. a) Total fluorescent signal (intensity) using proximity ligation assays (PLA) for cells exposed to control (no peptide), 50 μM TAT for 6 hours or 25 μM TAT-eNOS:RRKRK-TAT or TAT-scrambled-TAT for 6 and 24 hours. PLAs were performed to assess eNOS/p38 interactions (left) and eNOS/VDAC1 interactions (right). b) Representative images of eNOS/p38 PLA signal (red, left) or eNOS/VDAC1 PLA signal (green, right) with nuclear stain (blue) for the different PLA treatment groups. Scale bar indicates 50 μm. * = p < .05 between designated groups. † = p< .05 between indicated group and TAT, NS = non-significant.