Figures & data
Figure 1. Mechanism of electrostatic interaction between PS of PKC ζ and the target protein (here p62). In a normal situation PS interacts with a part of the target protein (here PB1). The zeta inhibitory peptide (ZIP) competes with the PS and prevents interaction between the enzyme and the protein. Phosphorylation and activation of the target protein does not occur.Citation34
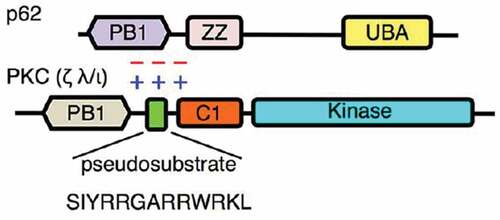
Table 1. Permeation enhancers used and their suggested mechanism of action.
Table 2. Designation and structures of peptides used.
Figure 2. Comparison of permeability enhancement between L-R5 and other PEs. The permeability of FD-4 (0.25 mM solution) through Caco-2 epithelial cell layers was measured in the presence of L-R5 50 µM, Bilobalide 5 µM and Latrunculin A 0.2 µM over 180 minutes (A). TEER was measured before and after the experiment (B). The permeability of FD-4 (0.25 mM solution) through Caco-2 epithelial cell layers was measured in the presence of L-R5 50 µM, C10 8.5 mM and SDS 2 mM over 180 minutes (C). TEER was measured before and after the experiment (D). Values are mean ± S.D. (n = 3), ***P < 0.001, ****P < 0.0001. The data were analysed using multiple t-test comparisons.
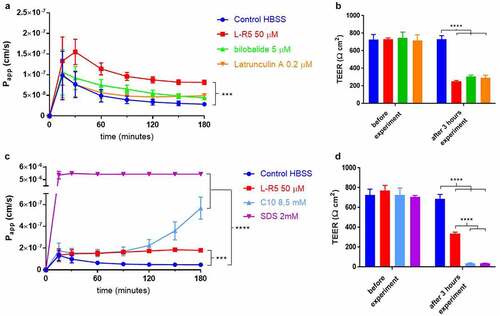
Figure 3. Toxicity comparison between L-R5 and FAs. The haemolytic activity measured in fresh defibrinated sheep blood (47.2 × 10⁶ cells/ml), incubated with various concentrations (5–1000 µM) of L-R5 and FAs (octanoyl, myristoyl, myristoleyl, palmitoyl) for 30 minutes at room temperature under slow shaking. HBSS and water for injection (WFI) were used as negative (0%) and positive (100 %) controls, respectively (A). Cytotoxicity was measured by WST-1 test. Caco-2 cells were incubated for 24 hours with various concentrations of L-R5 (25–100 µM) and FAs (50 and 500 µM). SDS 0.1% and cell culture medium were used as positive (0%) and negative control (100%), respectively (B). Values are mean ± S.D. (n = 3).
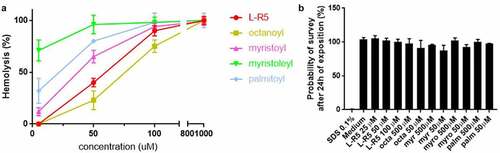
Figure 4. Comparison of permeability enhancement between L-R5 and other PEs. The permeability of FD-4 (0.25 mM solution) through Caco-2 epithelial cell layers in the presence of L-R5, myristoyl, myristoleyl, octanoyl and palmitoyl (all at a concentration of 50 µM) was investigated over 180 minutes (A). TEER was measured before and after the experiment (B). Values are mean ± S.D. (n = 3), *P < 0.05, ***P < 0.001. The data were analyzed using multiple t-test comparisons.
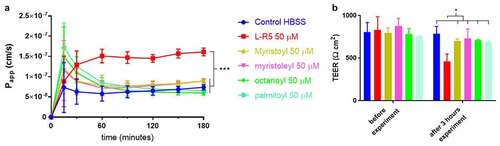
Figure 5. Size-dependent increase in permeability by L-R5. The permeability of sodium fluorescein, FD-4 and FD-150 (all 0.25 mM solution) through Caco-2 epithelial cell layers was measured in the presence of L-R5 (50 µM) over 180 minutes. Values are mean ± S.D. (n = 3), ****P < 0.0001. The data were analyzed using multiple t-test comparisons.
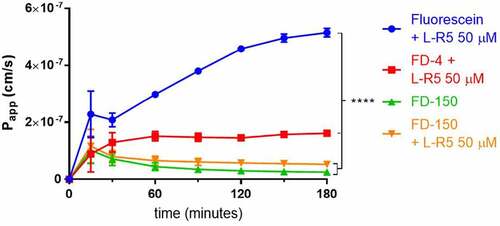
Figure 6. Permeability enhancement comparison between L-R5 and structural modifications of L-R5. The permeability of FD-4 (0.25 mM solution) through Caco-2 epithelial cell layers in the presence of L-R5, L-R5 with the tryptophan replaced by an alanine and L-R5 with the first arginine replaced by an alanine (all at a concentration of 50 µM) was investigated over 180 minutes (A). TEER was measured before and after the experiment (B). Values are mean ± S.D. (n = 3). *P < 0.05, ***P < 0.001. The data were analysed using multiple t-test comparisons.
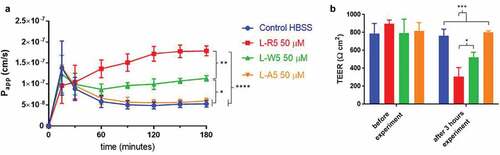
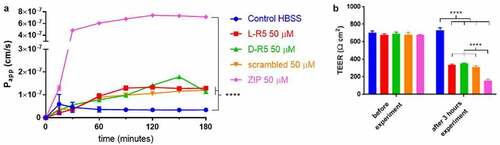
Figure 7. Permeability enhancement comparison between L-R5, its D form (D-R5), its scrambled form and ZIP. The permeability of FD-4 (0.25 mM solution) through Caco-2 epithelial cell layers was measured in the presence of L-R5, D-R5, scrambled L-R5 and ZIP (all at a concentration of 50 µM) over 180 minutes (A). TEER was measured before and after the experiment (B). Values are mean ± S.D. (n = 3). ****P < 0.0001. The data were analysed using multiple t-test comparisons.