Figures & data
Figure 1. Transmission electron microscopy image showing average diameters of ZnO-NPs.
Figure 2. Measurements of biochemical parameters; BUN, blood urea nitrogen; Values are displayed as mean ± standard errors (X ± SEM); a: P compared to control group; b: P compared to DN group; #: P< .05; ##: P< .001; n = 10.
Table 1. Measurements of oxidative stress and inflammatory parameters.
Figure 3. Real-time PCR analyses of mRNA levels of nephrin, podocin, beclin-1, LC3 and p62 in the renal cortex. Values are displayed as mean ± standard errors (X ± SEM); a: P compared to control group; b: P compared to DN group; #: P< .05; ##: P< .001; n = 10.
Figure 4. A photomicrograph for H&E-stained sections in adult male rats’ renal cortex. a Control group, the glomerulus (g) appears normal, Bowman’s capsule is lined by simple squamous cells (SC) and Bowman’s space (s) appears narrow. Proximal (p) and distal convoluted tubules (d) are seen. b–e DN group. b The glomerulus (G) shows mesangial expansion (*). Some tubules have vacuolated lining cells (v), small dark nuclei (n) and hyaline (h) and cellular (c) casts within their lumen. The interstitium shows infiltrating mononuclear inflammatory cells (i) and thickened blood vessels (bv). c The glomeruli (G) show mesangial expansion (*) and narrow Bowman’s space (s). The interstitium shows congested blood vessel (bv) surrounded by an exudate (e), a blood vessel with thickened wall (bv) and extravasated red blood cells (r). d The glomeruli (G) appear segmented with mesangial expansion (*). The tubules have hyaline (h) casts within their lumen. The interstitium shows infiltrating mononuclear inflammatory cells (I), dilated congested blood vessels (bv) and increased fibrous tissue (f). e The glomeruli (G) appear segmented (star) with swollen parietal layer of Bowman’s capsule (pc). Notice dilated congested blood vessel within the interstitium (bv). f DN + ZnO-NPs, the glomeruli (G) appear almost normal, Bowman’s capsule is lined by simple squamous cells (SC) and the Bowman’s space (s) is about normal. Nearly normal proximal (P) and distal convoluted tubules (D) are seen.
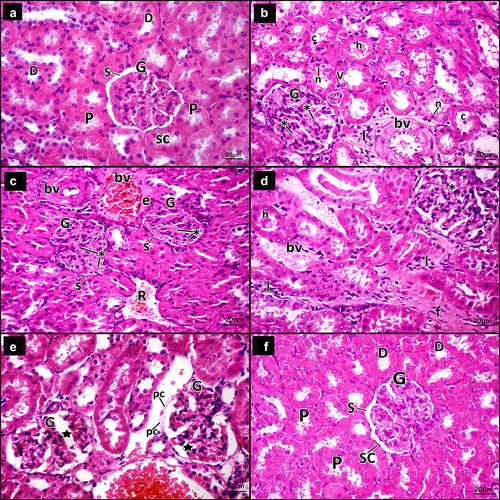
Figure 5. Mallory’s trichrome stained sections of the renal cortex of the study groups. Collagen fibers (arrow) a Control group, showing few collagen fibers. b DN group, showing increased collagen fibers around renal tubules and renal corpuscles, in between glomerular capillaries and within and around the wall of the blood vessels (bv). c DN + ZnO-NPs, showing nearly normal distribution of collagen fibers. d The mean area % of collagen fibers in Mallory’s trichrome-stained sections. Values are displayed as mean ± standard errors (X ± SEM); a: P compared to control group; b: P compared to DN group; #: P< .05; ##: P< .001.
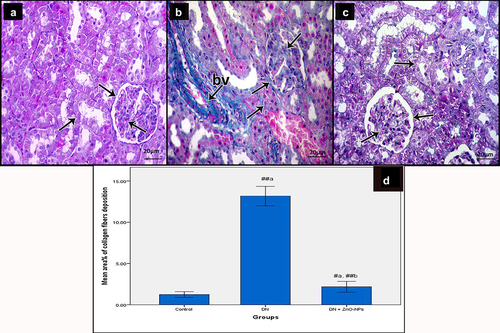
Figure 6. Periodic acid Schiff-stained sections of the renal cortex of the study groups. a Control group, showing reaction in the basement membrane (arrow) of tubular epithelium (t), glomerular capillaries (g) and along with the parietal epithelial cells of Bowman’s space (p). The reaction also appears in the brush borders of the renal tubules (b). b DN group, showing increased reaction in the basement membrane (arrow) of tubular epithelium (t), glomerular capillaries (g) and along with the parietal epithelial cells of Bowman’s space (p) in addition to increased mesangium (m). The reaction is increased in the brush borders of the renal tubules (b). c DN + ZnO-NPs, showing nearly normal reaction in the basement membrane (arrow) of tubular epithelium (t), glomerular capillaries (g) and along with the parietal epithelial cells of Bowman’s space (p). The reaction also appears in the brush borders of the renal tubules (b). d The mean area % of positive reactions in PAS-stained sections, values are displayed as mean ± standard errors (X ± SEM); a: P compared to control group; b: P compared to DN group; #: P< .05; ##: P< .001.
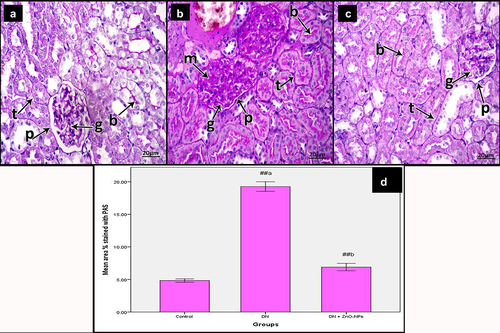
Figure 7. Immune histochemical-stained sections for P53 in the renal cortex of albino rats in the study groups. P53 nuclear immune reactions (p). a Control group, reaction appears in few cells. b DN group, showing the reaction in many cells. c DN + ZnO-NPs groups, showing the reaction in some cells. d The average count of brown nuclei in anti-p53 immune-stained sections. Estimates are displayed as mean ± standard errors (X ± SEM); a: P compared to control group; b: P compared to DN group; #: P< .05; ##: P< .001.
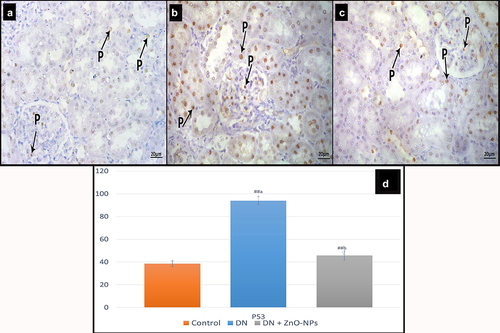
Figure 8. Immune histochemical-stained sections for AQP11 cytoplasmic immune reaction (a). a Control group, most of the tubular cells show intense reaction. b DN group, some tubular cells show faint reaction. c DN + ZnO-NPs group, showing nearly normal reaction in the tubular cells. d the mean area % of positive immunoreactions in anti-aquaporin-11 immune-stained sections. Estimates are displayed as mean ± standard errors (X ± SEM); a: P compared to control group; b: P compared to DN group; #: P< .05; ##: P< .001.
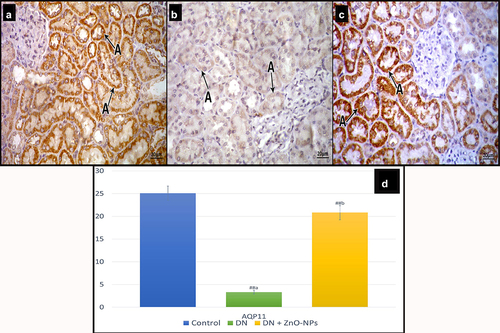
Figure 9. Immune histochemical-stained sections for mTOR showing cytoplasmic and nuclear immune reaction (m). a Control group, few mTOR immunoreactive cells can be detected. b DN group, showing increased mTOR immune reactions both in the tubular and the glomerular cells. c DN + ZnO-NPs group, some immune reactive cells are seen. d The mean area % of positive immunoreactions in anti-mTOR immune-stained sections. Estimates are displayed as mean ± standard errors (X ± SEM); a: P compared to control group; b: P compared to DN group; #: P< .05; ##: P< .001.
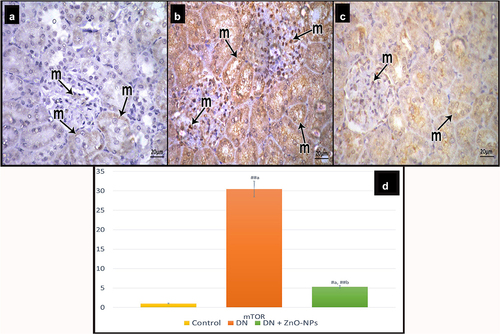
Figure 10. Electron micrographs of sections in the glomeruli of adult male rats in all study groups. a Control group, the glomerulus reveals part of the podocyte cell body (Pd) from which the primary processes (pp) arise. The filtration barrier is formed of many thin foot processes (f), glomerular basement membrane (BM) and fenestrated endothelium (e) of the glomerular capillaries (c). Notice red blood cells (r) in the lumen of the glomerular capillary. b DN group, the filtration barrier appears disturbed; the podocyte foot processes show effacement (F), some areas of the glomerular basement membrane appear thickened (BM) and the glomerular capillary (C) shows disappearance of fenestrated endothelium in some areas (e). Notice the nucleus of the endothelium (Ne). Red blood cells (R) appear in the lumen. c DN + ZnO-NPs group, the filtration barrier is formed of numerous thin foot processes (F) arising from the primary processes (pp) of podocyte, thin glomerular basement membrane (BM) and fenestrated glomerular endothelium (e). The glomerular capillary (C) endothelium has a heterochromatic nucleus (Ne) with red blood cells (R) in the lumen.
Figure 11. Electron micrographs of sections for proximal convoluted tubules of adult male rats in all study groups. a Control group, proximal tubular cells rest on thin regular basement membrane (BM). The tubular cells have regular euchromatic nuclei (n) with prominent nucleoli (n) and regularly packed apical microvilli (mv), the basal parts of the cells show basal infoldings (i) with regularly arranged mitochondria (m). b DN group, the proximal tubular cells rest on thick basement membrane (BM). They have heterochromatic nuclei (N), rarified cytoplasm (*) with some vacuolated areas (v) and disorganized apical microvilli (mv). The basal parts of the cells show disorganized basal enfolding with disorganized mitochondria (M). c DN + ZnO-NPs group, the proximal tubular cell rests on a thin regular basement membrane (BM). It has normal cytoplasm with evident vacuoles (V), a regular euchromatic nucleus (N), lysosomes (l) and regularly packed apical microvilli (mv). The basal part of the cell shows basal infoldings (I) with regularly arranged mitochondria (M).
Figure 12. Electron micrographs of sections in the collecting tubule of adult male rats in all study groups. a Control group, the collecting tubular cells have regular euchromatic nuclei (n) with prominent nucleoli (n). They have smooth apical membrane away from few short microvilli (mv) and numerous mitochondria (m). The cells are attached to each other by tight junctions (j). b DN group, the collecting tubular cell has rarified cytoplasm (*) and bizarre shaped mitochondria (M) and rests on a thick basement membrane (BM). c DN + ZnO-NPs group, the collecting tubular cells have regular euchromatic nucleus (N) with prominent nucleoli (n). They have smooth apical membranes (a), numerous mitochondria (M) and apparent vacuoles (v). The cells are attached to each other by tight junctions (J).