Figures & data
Table 1. Primary and secondary antibodies used for this study are shown including the concentrations in Western blot (WB) experiments and in immunostaining (IS).
Figure 1. Plakophilin2 and Plakophilin3 are expressed in human intestinal tissue.
(a) Representative Western blots from human colonic tissue of healthy donors (left), human intestinal organoids (middle) and Caco2 cells (rights) for PKP1, PKP2 and PKP3 are shown. Cell lysates of HaCAT which express PKP1-3 were used as positive controls. The Western blots demonstrate that PKP1 is not expressed in intestinal epithelium. PKP2 and PKP3 are both expressed in all samples β-actin is shown as loading control; Western blots shown are representative for n > 5. (b) Quantitative (q)real time-PCR was performed for PKP1, PKP2 and PKP3 from RNA of Caco2 cells confirming that PKP1 ist not detectable. In contrast PKP2 and PKP3 mRNA is present in Caco2 cells. RNA-levels are normalized relative to b-actin; n = 4 (c) In Immunostaining of Caco2 cells of PKP1 is not visible. PKP2 and PKP3 are both regularly distributed along the cell borders in in Caco2 monolayers; n > 5; scale bar is 20 micrometer.
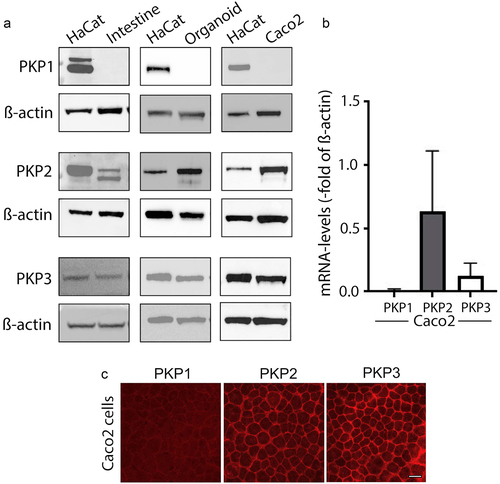
Figure 2. Effects following knockdown of PKP2, 3 or PKP2/3.
(A)- (C) Representative Western Blots of Caco2 cell lysates are shown to document the sufficient knockdown of PKP2 (A) PKP3 (B) or both PKP2/PKP3 (C) together; β-actin is shown as loading control (n > 5 for each condition.(D)- (F) Images of dispase-based enterocyte dissociation assays are shown for knockdown of PKP2 (D) PKP3 (E) or both PKP2/PKP3 (F) in comparison to cells incubated with nontarget siRNA (n.t.); this demonstrated that loss PKP2 but not PKP3 resulted in increased cell dissociation. The effect observed in response to PKP2 knockdown is more pronounced when both PKP2 and PKP3 are both reduced; n = 5 experiments for each condition(G) Bar graphs of the quantifications of the dispase-based enterocyte dissociation assays are shown under different experimental conditions; n.s. = no significant differences; **** p < .0001.(H) Bar graph of cell viability assays are shown to demonstrate that cell viability was not affected following loss of PKP2 and PKP3; n.s. = no significant differences; n = 11 for each conditions.(I) TER measurements were carried out showing that loss of PKP2 and PKP2/3 but not PKP3 alone affect the maturation of intestinal barrier function; *** p < .001 compared to control, **** p < .0001 compared to control; n = 11.(J) Permeability measurements using 4 kDa FITC-dextran across Caco2 monolayers are shown for the different experimental conditions. Loss of PKP2 and PKP2/3 led to augmented permeability across Caco2 monolayers. Knock-down of PKP3 did lead to changes of epithelial permeability compared to controls; n.s. = no significant differences; ** p < .01; **** p < .0001; n = 12–14 for each condition.
Figure 3. Effects of PKP knockdown on desmosomal proteins in Caco2 cells
(a) Western Blot showing potential alterations of PKP2, PKP3, plakoglobin (PG), desmoplakin (DP), desmoglein 2 (DSG2), desmocollin 2 (DSC2), E-cadherin (E-cad) in response to PKP2 knockdown (left) or PKP2/3 (right) knockdown. Following loss of PKP2 reduced levels of PKP3, PG, DSG2 and DSC2 were observed. This was also case when PKP2 and 3 were reduced together. Under these conditions DP was also reduced. E-cadherin remained unaltered under both experimental conditions. β-actin is shown as loading control; n.t. = nontarget siRNA; OD = optical density normalized to β-actin density n = 6(b) Immunostaining for the different desmosomal proteins is shown under control conditions (n.t. = nontarget siRNA) and after transfection with PKP2 or PKP2/3 siRNA. The staining patterns of PG, DP, DSG2 and DSC2 were reduced at the cell borders following knockdown of PKP2. The changes were more pronounced after PKP2/3 knockdown. Images shown are representatives for n = 6 experiments; scale bar is 25 micrometer
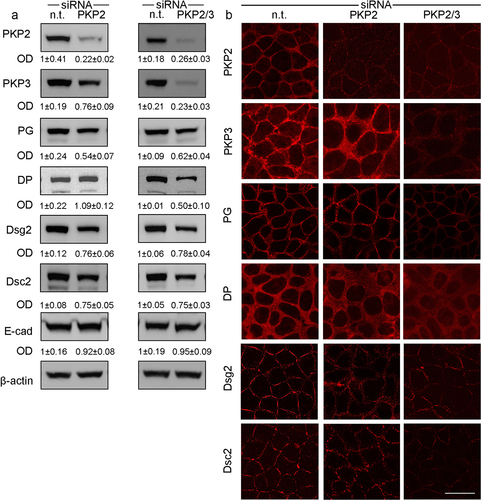
Figure 4. Protein kinase C is involved in barrier-compromising effects by PKP2.
(a) ELISA based measurements of PKC activity are shown in Caco2 cells under the different conditions following knockdown of PKP2, PKP3 and PKP2/3. This showed that PKC activity was reduced following loss of PKP2 and PKP2/3. Application of PMA restored PKC activity to control levels. * p < .01; ** p < .001; n = 5(b) Western blots on the effects of PMA (5 h) on tight junction proteins claudin1 and claudin4 following PKP2 (upper Blots) and PKP2/3 (lower Blots) knockdown in Caco2 cells are shown; under both conditions Claudin1 and Claudin4 were reduced. The loss of both tight junction proteins was abolished when PKC activity was restored using PMA; n = 6(c)+ (D) Measurements of TER under conditions of PKP2 knockdown (C) and PKP2/3 (D) knockdown are shown in comparison with controls with and without application of PMA are shown. Under both conditions a temporary increase of TER following application of PMA was observed in knockdown monolayers and in controls; n = 5(E)- (H) Dispase-based enterocyte dissociation assays after 5 h of PMA treatment (E, F) and 24 h of PMA treatment (G, H) are shown under control conditions and following knockdown of PKP2 (E, G) and PKP2/3 (F, H). Loss of intercellular adhesion is evident following knock of PKP2 and PKP2/3 after 5 h and 24 h. PMA restored augmented fragmentation of monolayers following loss of PKP2 and PKP2/3 after 5 h whereas this effect was no more present 24 h after PKP2/3 knockdown; n = 5 for each condition; ** p < .001; **** p < .0001
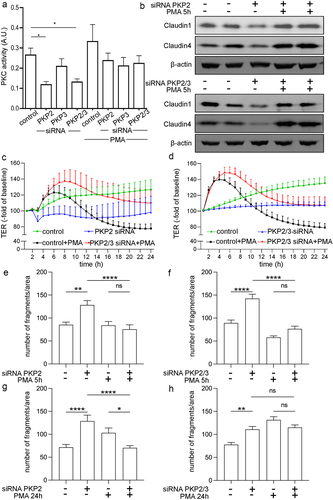
Figure 5. PKP2 interacts with protein kinase C.
(A) Co-Immunostaining of Caco2 cells stained for PKP2 or PKP3 together with PKC are shown. In merge images co-localization of PKP2 with PKC but not PKP3 with PKC can be assumed; DAPI was used to visualize cell nuclei; images shown are representative for n = 4; scale bar is 25 micrometer.(B) Immunostaining for PKP2 and PKP3 (left) and proximity ligation assays (PLA) for PKP2 and PKC and PKP3 and PKC are shown. The red spots (highlighted in the inset) indicate a direct interact between PKP2 and PKC but not between PKP3 and PKC; n = 4; scale bar is 25 micrometer.(C) Co-immunoprecipitation experiments demonstrate the interaction between PKP2 and PKC whereas control IgG and PKP3 do not show specific bands for PKC; n = 4.
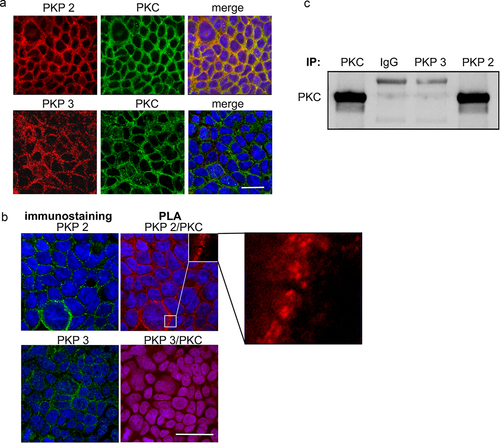
Figure 6. PKP2 and PKP3 overexpression had no effect on barrier functions.
(A) Representative Western Blots of PKP2, PKP3, PKC protein levels under control conditions and after transfection of Caco2 cells with PKP2- or PKP3- Quantitative analyses of all Western blot experiments for PKP3 expressing plasmids. OX = overexpression; β-actin was used as loading control.(B) Quantitative analyses of all Western blot experiments for PKP2 are shown. PKP2 protein levels were increased in Caco2 cells overexpressing PKP2; n = 5, ****<0.0001(C) Quantitative analyses of all Western Blot experiments for PKP3 protein levels are shown- n = 6, ***<0.001, ****<0.0001(D) PKC protein expression was not changed following overexpression of PKP2 and PKP3 when compared to controls; n = 4, ns(E) Measurements of TER under conditions of PKP2 overexpression and PKP3 overexpression showed no significant changes in the time course of measurements and in comparison to controls, n = 4.
Figure 7. PKP3 overexpression in Caco2 cells attenuated the effect of PKP2 siRNA.
(A) Representative Western Blots of Caco2 cells after silencing of PKP2 and Co-transfektion with PKP3 overexpressing plasmid (+ PKP3 OX) for PKP2, PKP3 and PKC are shown; β-actin was used as a loading control.(B) Quantitative analyses of all Western blot experiments for PKP2 expression are shown. After PKP2 silencing PKP2 level were reduced, co-transfection with PKP3 plasmid restored PKP2 levels; OX = overexpression; n = 5, **<0.01, ***<0.001.(C) Quantitative analyses of all Western blot experiments for PKP3 expression are shown to verify the overexpression of PKP3. n = 4, ***<0.001(D) Quantitative analyses of all Western blot experiments for PKC are shown; no differences were observed; n = 6.(E) TER measurements were carried out in Caco2 monolayers after PKP2 siRNA and after additional overexpression of PKP3. Loss of TER was observed after knockdown of PKP3. This was attenuated by simultaneous application of PKP3 overexpressing plasmid; OX = overexpression; n = 4, ***<0.001