Figures & data
Figure 1. Mucus layer thickness and the number of AB-PAS-positive cells per mm2 surface area in distal ileum of premature lambs. Compared to control lambs, mucus layer thickness was increased in 7d UP exposed animals (a). Compared to control lambs (b), the number of AB-PAS positive cells was increased in UP exposed lambs (c) in the lower villus region (d), middle villus region (e) and in the total villi (f). Each data point represents the mucus layer thickness or average cell count of one lamb. Data are displayed as median with interquartile range. Scale bar indicates 100 µm. *p < 0.05. Abbreviations: AB-PAS: alcian blue/periodic acid Schiff, IA: intra-amniotic, UP: Ureaplasma parvum.
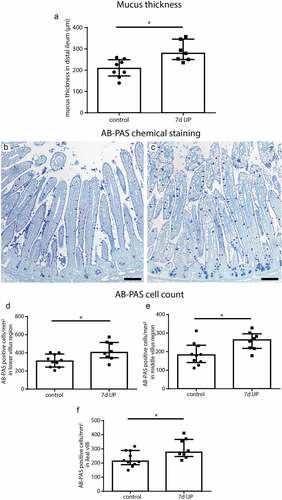
Figure 2. Mild inflammation in the ileum of premature lambs. Mild inflammation was detected in IA UP exposed animals compared to controls, although none of the comparisons reached statistical significance. A mild increase in IBA1 positive surface area (macrophages) (black arrows) (A, B, C), TNFα mRNA expression (d) and TGFβ mRNA expression (e) was detected in the ileum of IA UP exposed lambs compared to controls. (f) The composite z-score of the intestinal inflammatory data sets (IBA1, TNFα and TGFβ) tended to be increased (p = 0.10) following 7d IA UP exposure compared to controls. Each data point represents the average positive surface area or relative mRNA expression of one lamb. Data are displayed as median with interquartile range. Scale bar indicates 100 µm. #0.05 < p ≤ 0.10. Abbreviations: IA: intra-amniotic, IBA1: ionized calcium-binding adaptor molecule 1, TNFα: tumor necrosis factor α, TGFβ: transforming growth factor β, UP: Ureaplasma parvum.
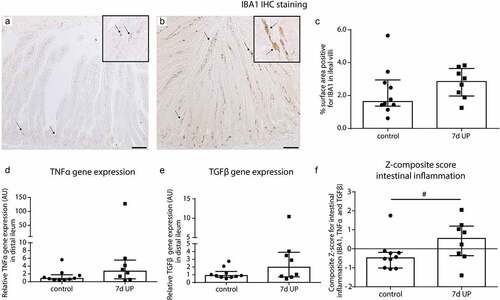
Figure 3. BiP expression pattern along crypt-villus axis, the number of CHOP-positive cells per mm2 surface area and the number of CC3-positive cells per mm2 surface area in distal ileum of premature lambs. The BiP expression pattern of controls (a, c) was comparable to that of IA UP exposed lambs (b, c). Compared to controls (D, F, G), CHOP positive cell count was increased after 7d UP exposure in ileal crypts (e, f) and ileal villi (e, g). The CC3-positive cell count was not statistically significantly different between control (h, j) and IA UP exposed animals (I, J, K). However, two IA UP exposed animals had high CC3-positive cell counts and these cells were detected in the lower villus region (j, k). Each dat point represents the average CHOP- or CC3-positive cell count of one lamb. Data are displayed as median with interquartile range. Scale bar indicates 100 µm. **p < 0.01. Abbreviations: IA: intra-amniotic, BiP: binding immunoglobulin protein, CC3: cleaved caspase 3, CHOP: C/enhancer binding protein homologous protein, IA: intra-amniotic, UP: Ureaplasma parvum.
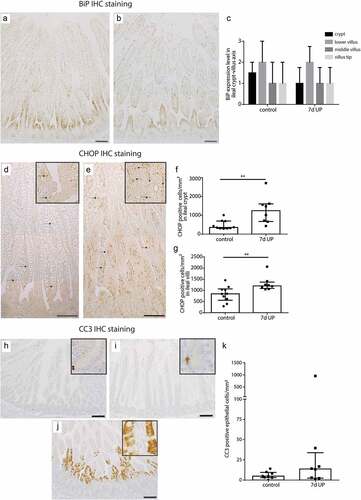
Figure 4. Organelle and cellular morphology of secretory cells (goblet cells and Paneth cells) in the crypt to villus transition region in the distal ileum of premature lambs imaged with TEM. In control animals, mitochondria (A; red arrows, cristae indicated by small red arrows), RER (C; orange arrows) and Golgi apparatus (E; purple arrows) of secretory cells had a structurally normal appearance. In IA UP exposed animals, these organelles were morphologically disrupted (B, D, F). In addition, cells with necrotic characteristics (green arrows) were observed in the lumen (l) of IA UP exposed animals (h), but not in controls (g). Abbreviations: IA: intra-amniotic, L: lumen, RER: rough endoplasmic reticulum, TEM: transmission electron microscopy, UP: Ureaplasma Parvum.
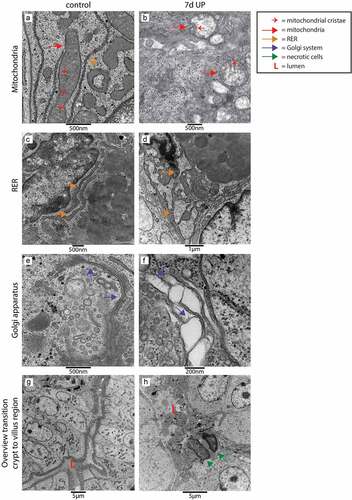
Figure 5. Organelle and cellular morphology of enterocytes in the villus region in the distal ileum of premature lambs imaged with TEM. Mitochondria (A; red arrows, mitochondrial cristae indicated by small red arrows) and RER (C; orange arrows) of enterocytes were normal in control animals. In IA UP exposed animals these organelles were morphologically disrupted (b, d). In addition, enterocytes containing small vacuoles (blue arrows) were observed in control animals (e), whereas larger vacuoles were detected in IA UP exposed lambs (f). Abbreviations: IA: intra-amniotic, L: lumen, RER: rough endoplasmic reticulum, TEM: transmission electron microscopy, UP: Ureaplasma Parvum.
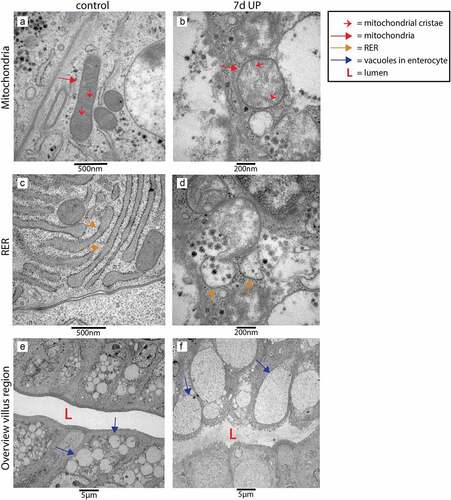
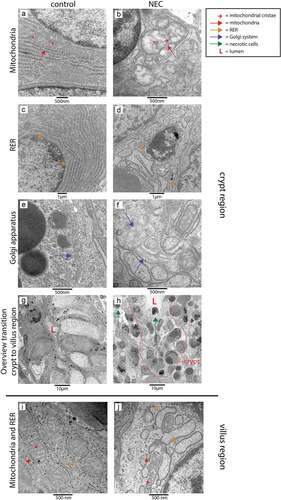
Figure 6. Organelle and cellular morphology of enterocytes and secretory cells (goblet cells and Paneth cells) in the ileal crypt region and villus region of NEC patients and controls detected with TEM. Mitochondria (red arrows; mitochondrial cristae indicated by small red arrows), RER (orange arrows) and the Golgi apparatus (purple arrows) of epithelial and secretory cells were normal in the crypt region of control infants (A, C, E), but morphologically disrupted in the NEC patients (B, D, F). Interestingly, compared to control ileal samples (g), large amounts of intestinal cells with necrotic characteristics (green arrows) were present in the crypts of NEC patients (h). Similarly, mitochondria (red arrows, mitochondrial cristae are indicated by small red arrows) and RER (orange arrows) appeared normal in goblet cells and enterocytes in the ileum of control infants (i), whereas these organelles were morphologically disrupted in goblet cells and enterocytes in the ileum from NEC patients (j). Abbreviations: L: lumen, NEC: necrotizing enterocolitis, RER: rough endoplasmic reticulum, TEM: transmission electron microscopy.