Figures & data
Figure 1. Small EV collection, isolation, and characterization scheme. H, hypoxia; N, normoxia; MC, media control.
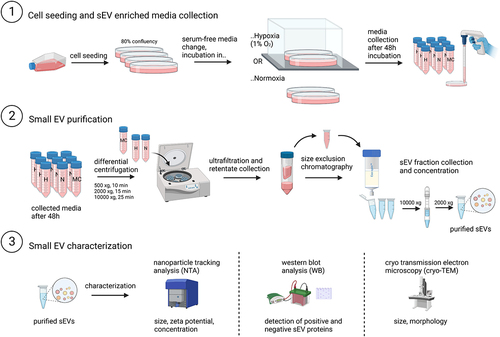
Figure 2. Effect of different serum composition in media in ThinCert® insert model. (a) Schematic representation of an insert with indicated apical and basolateral compartment and experimental workflow to obtain the HTB-41 B2 SSGB model. Media used for treatment on apical (a) and basolateral (b) side of the insert was either serum free, supplemented with 10% fetal bovine serum (FBS), or 10% sEV depleted FBS. Effects of different media composition were recorded with a CellZscope device for continuous monitoring, where (b) transepithelial electrical resistance (TER) and (c) capacitance of cell layers (CAP) were measured in 1 h intervals. Data were normalized to the timepoint 1 h after sEV addition. (b,c) data are represented as mean ± SEM, N = 3–5, n = 5–14. In table S3 (TER) and table S4 (CAP) statistically significant differences for all conditions are listed.
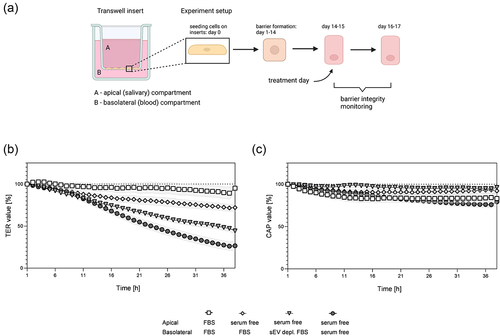
Figure 3. Characterization of sEvs derived from DU145 cells in hypoxic (H) − 1% O2 or normoxic (N) – atmospheric O2 conditions. Shown are representative graphs of (a) size distribution with indicated median (M (size)) and (b) zeta potential with indicated mean ZP (M (ZP)) of H and N sEvs measured with nanoparticle tracking analysis (NTA). c) cryo-TEM image of DU145 N sEvs. Scale bar = 100 nm. (d) Western blot analysis confirmed the presence of β-actin, sEV enriched (Alix, CD9, CD81) and absence of a sEV negative marker (GM130), as well as hypoxia regulated phosphorylation of ERK1/2. (e) Relative levels of ERK proteins were calculated as described in 2.11. N = 3 of pooled samples, n = 3 ± SEM.
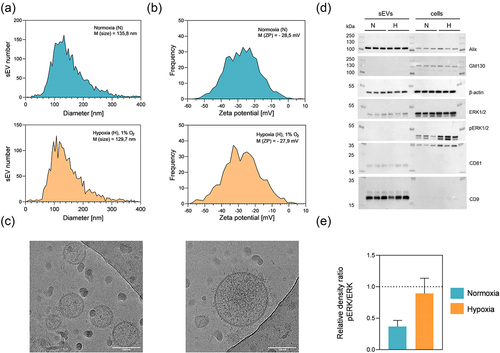
Figure 4. Barrier integrity after addition of DU145 sEvs on the basolateral side of the SSGB model (HTB-41 clone B2 cells on ThinCerts®). On the apical (salivary) side, media without serum were used, on the basolateral (blood) side either media with 10% FBS (a) or serum-free (b) media were applied. Transepithelial electrical resistance (TER) and capacitance of the cell layer (CAP) were recorded using a CellZscope device. Data normalized to data 1 h after media change (a,b) are shown as mean values ± SEM. N = 3–4, n = 8–12. Significant differences were observed between basolateral FBS vs. serum-free conditions, whereas sEV treatment exhibited no statically different effects. Significant differences are listed in table S5 (TER) and table S6 (CAP).
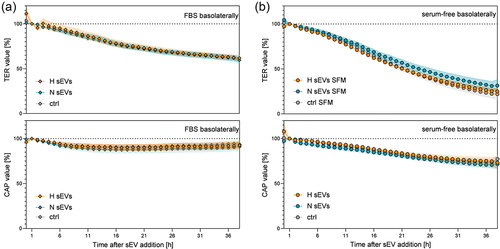
Figure 5. Changes at the molecular level after basolateral treatment of the SGGB model with H or N DU145 sEvs in serum-free or 10% FBS supplemented medium. (a) for the same samples mRNA expression of selected targets in HTB-41 clone B2 barrier after treatment with H or N DU145 sEvs for in either serum-free media or 10% FBS added basolaterally. n = 3, N = 3 pooled samples. Compressed legend. (b) Protein expression of E-cadherin, ZO-1, ß-actin and claudin-7 visualized by Western blotting. (c) Quantified protein expression levels of claudin-7, E-cadherin and zonula occludens-1 (ZO-1). Relative protein expression levels were determined by calculating relative density ratios to ß-actin and then normalized to 10% FBS control. Mean ± SEM, n = 3, N = 3 of pooled samples. E-cadherin expression between basolateral 10% FBS vs. serum-free control; p = 0.0439.
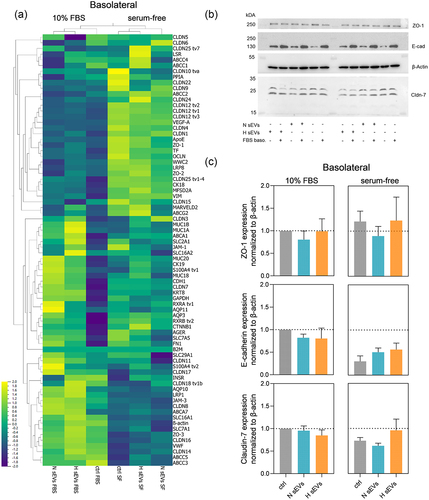
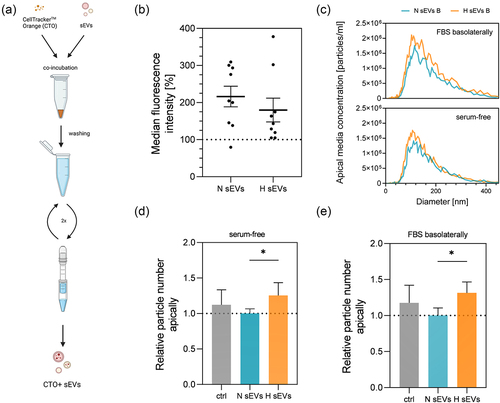
Figure 6. Uptake of CTO labeled hypoxia derived (H) and normoxia derived (N) sEvs measured with flow cytometer after 40 h incubation. (a) sEV labeling scheme with CellTrackerTM orange. (b) uptake of CTO+ H and N sEvs. Mean ± SEM n = 9, N = 3. (c) size distribution of sEV particles in the apical compartment after treatment with either H or N sEvs from the basolateral side in different serum conditions basolaterally. Data are represented as an average of three measurements, n = 3–4, N = 3–4. (d,e) sEV particles measured in the apical compartment with nanoparticle tracking analyzer 40 h after treatment with either H or N sEvs in the basolateral compartment in (d) serum-free or (e) 10% FBS and serum-free apically. Apical media collected after incubation period was subjected to a series of centrifugation steps as described in 2.5 to deplete any cells, apoptotic bodies, or larger vesicles. Data was normalized to normoxic sEV treatment. (d) Mean ± SD n = 11, N = 4 of pooled samples. (e) Mean ± SD, n = 8, N = 3 of pooled samples. Data was analyzed with one-way ANOVA followed by pairwise Holm-Šidak’s multiple comparison post hoc tests, (d) p = 0,0032, (e) p = 0.0056.