
Figures & data
Table 1. The combination ratios of the template and functional monomer.
Figure 1. SEM images of (A) PHEMAPA (B) PHEMAPA-l-Phe cryogels.
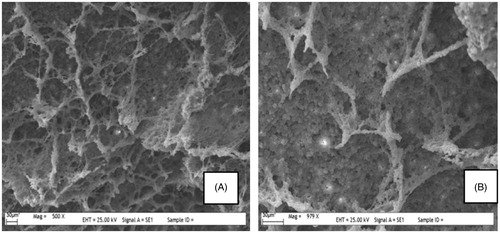
Figure 2. The effect of adsorption conditions on l-Phe adsorption onto PHEMAPA-l-Phe cryogel membranes. (A) Effect of pH (l-Phe concentration: 0.5 mg/mL; flow rate: 1 mL/min; adsorption time: 2 h; T: 25 °C) (B) Effect of flow rate (l-Phe concentration: 1.0 mg/mL; pH: 5.5; adsorption time: 2 h; T: 25 °C). (C) Effect of l-Phe concentration (pH: 5.5; flow rate: 1.0 mL/min; adsorption time: 2 h; T: 25 °C) (D) Effect of temperature (l-Phe concentration: 1.5 mg/mL; pH: 5.5; adsorption time: 2 h) (E) Effect of ionic strength (l-Phe concentration: 1.5 mg/mL; pH: 5.5; adsorption time: 2 h; T: 25 °C) (F) Effect of salt type (l-Phe concentration: 1.5 mg/mL; salt concentration: 0.1 M; pH: 5.5; adsorption time: 2 h; T: 25 °C).
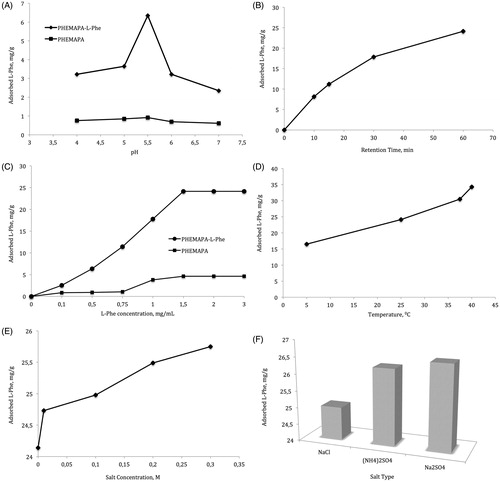
Table 2. The pseudo-first-order and pseudo-second-order kinetic constants for l-Phe adsorption.
Figure 3. Adsorption of competitor amino acids on PHEMAPA-l-Phe and PHEMAPA cryogels. Amino acid concentration: 1.0 mg/mL; pH: 5.5; adsorption time: 2 h; T: 25 °C.
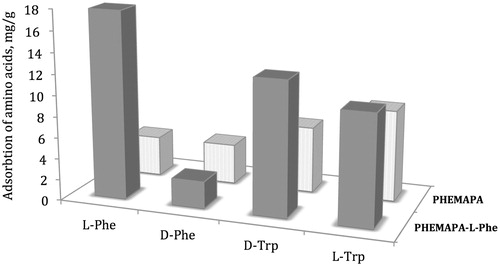
Table 3. Kd and k values for d-Phe, l-Trp, and d-Trp with respect to l-Phe.
Figure 4. FPLC separation of d-Phe and l-Phe with MIP column.
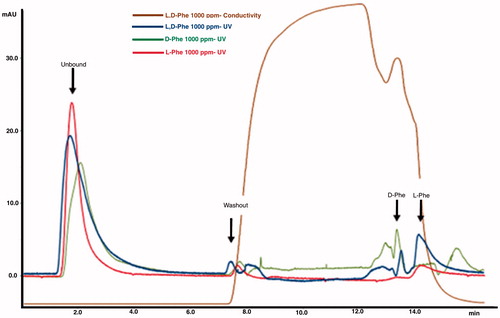
Table 4. The parameters calculated from the purification chromatograms.