Figures & data
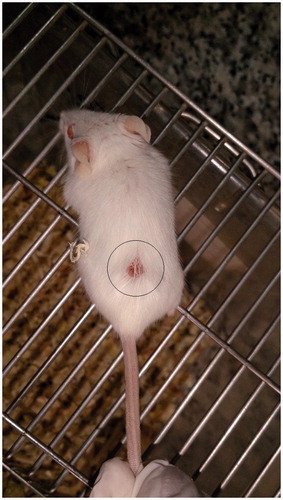
Figure 1. Tumor tissue formation. 106 4T1 cells were injected subcutaneously and the mass of tumor was generated after 12 days.
Scheme 1. Synthetic routes followed for the preparation of waterborne PU.
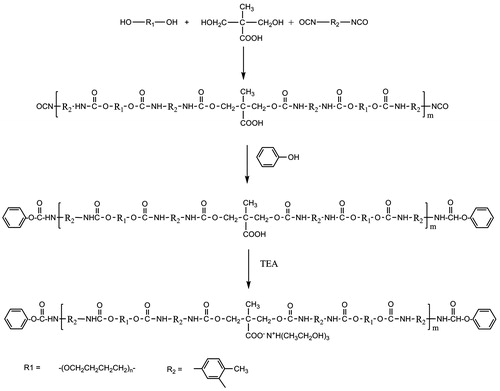
Figure 2. FTIR spectrum of waterborne PU.
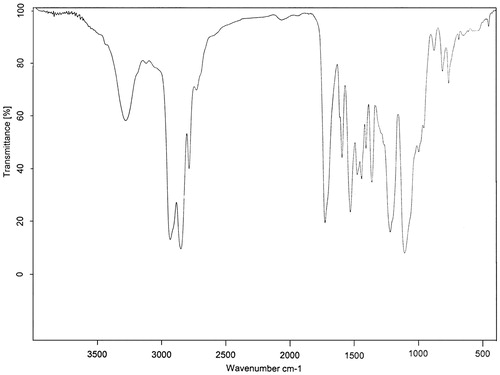
Figure 3. (A) Size distribution of ARE-loaded PU NMs. (B) Zeta potential of ARE-loaded PU NMs. The nanosystem showed the average size of 42.30 nm and the average charge of −26.2 mV.
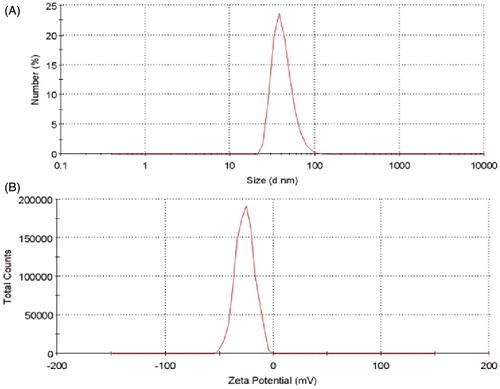
Figure 4. The release profile of ARE from PU NMs in citrate and phosphate buffer. After 24 h, 60.80% of total ARE embedded in PU NMs was released in citrate buffer, while this percentage was 3.2% in phosphate buffer in this time. After 48 h, 91.4% of total ARE was released in citrate buffer whereas just 4.2% of total drug in PU NMs was released in phosphate buffer.
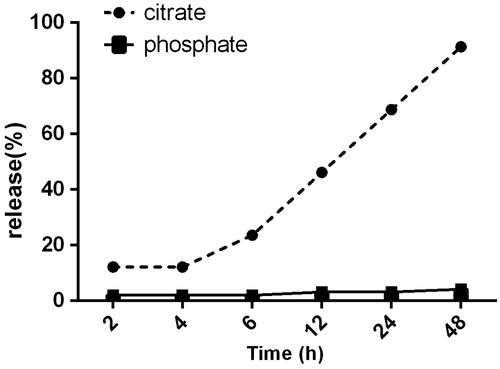
Figure 5. (A) MTT cytotoxicity assay on 4T1 cell line after 24 h. (B) MTT cytotoxicity assay on PBMCs after 24 h.
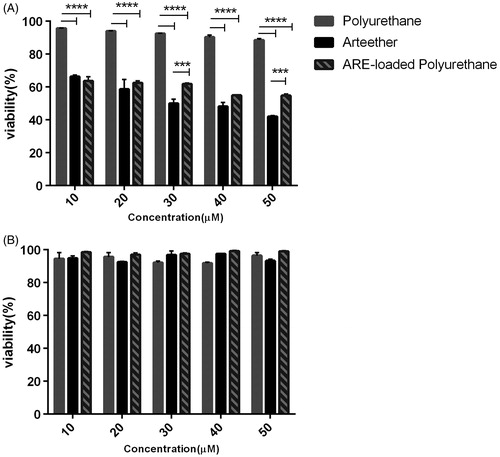
Figure 6. The tumor size in groups of ARE, ARE-loaded PU and PU NMs in comparison with CYC and the untreated group are shown. On the day of 17, the groups received ARE, ARE-loaded PU and CYC indicated a significant reduction in tumor growth as compared with the untreated group. There was no significant difference between the day of 17 as compared to the day of 11 in groups received ARE, ARE loaded PU and CYC and it is indicative of inhibition of tumor growth. The data also showed that PU did not have any effect on tumor growth control. Additionally, ARE loaded PU acts similarly with CYC in tumor growth inhibition.
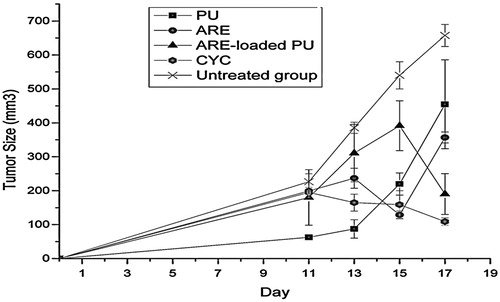
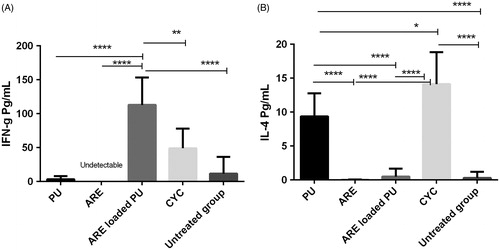
Figure 7. The assay of IFN-γ (A) and IL-4 (B) cytokines by enzyme-linked immunosorbent assays (ELISA). ARE-loaded PU NMs revealed a significant effect on production of IFN-γ while no effect on IL-4 generation was observed. According to the information, ARE did not show any effect on immune response.