
Figures & data
Table 1. Characteristics of synthesized AgNPs.
Figure 1. Minimum inhibitory concentration (MIC) of bare, low and high citrate coating of AgNPs against E. coli (ATCC5922) and S. aeruginosa (ATCC27853). The p values was <0.0001, considered extremely significant difference between MIC values of AgNPs against E. coli.
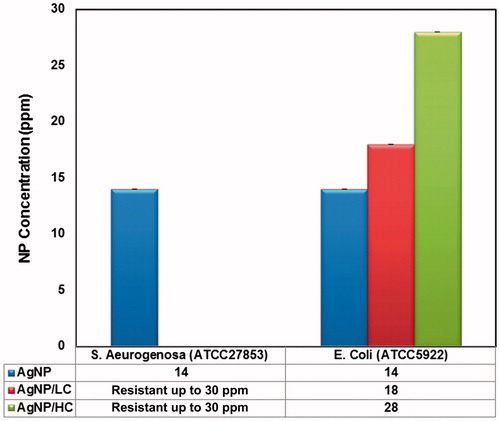
Figure 2. (a) Determination of free radical scavenger property at 2 and 28 ppm. Bare AgNPs induced significant free radical values as compared to low and high citrate coated AgNPs at 2 ppm (p <0.05 and p <0.01, respectively). At 28 ppm concentration the p values was 0.6681, considered not significant difference between ROS production of AgNPs. (b) LDH release from HUVECs treated with NPs. AgNPs induced non-significant free radical values as compared to each others at 2 ppm (p values was 0.0602). At 28 ppm concentration, although there was no significant difference between ROS production of bare and high citrate coated AgNPs, but bare AgNP and AgNP/HC induced higher LDH release as compared to AgNP/LC (p values was <0.001).
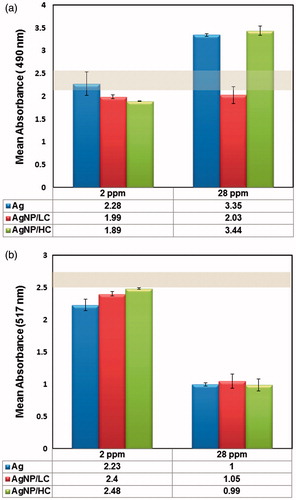
Figure 3. (a) Maximum half inhibitory concentration (IC50) of three different NPs with Human Caucasian neuroblastoma [BE (2)M17] (NB) and Mouse embryonic fibroblast cell line (STO) as immortal cells and HUVEC. There was significant difference between IC50 values of AgNP/HC and AgNP/LC (p< 0.05). (b) DAPI staining of HUVEC at 2, 12, and 24 ppm concentrations of AgNPs. AgNP/HC exhibited less light blue chromatin and damage to nucleus as compared to others. (c) Nucleus numbers of of HUVECs at 2, 12, and 24 ppm concentrations of AgNPs. Cells treated by AgNP/LC exhibited higher nucleus number as compared to others. At 2 ppm, the p values was 0.0001, considered extremely significant. There was not significant difference between Bare and AgNP/LC. At 12 ppm, p values was 0.0017, considered very significant. There was no significant difference between Bare and AgNP/HC.
![Figure 3. (a) Maximum half inhibitory concentration (IC50) of three different NPs with Human Caucasian neuroblastoma [BE (2)M17] (NB) and Mouse embryonic fibroblast cell line (STO) as immortal cells and HUVEC. There was significant difference between IC50 values of AgNP/HC and AgNP/LC (p< 0.05). (b) DAPI staining of HUVEC at 2, 12, and 24 ppm concentrations of AgNPs. AgNP/HC exhibited less light blue chromatin and damage to nucleus as compared to others. (c) Nucleus numbers of of HUVECs at 2, 12, and 24 ppm concentrations of AgNPs. Cells treated by AgNP/LC exhibited higher nucleus number as compared to others. At 2 ppm, the p values was 0.0001, considered extremely significant. There was not significant difference between Bare and AgNP/LC. At 12 ppm, p values was 0.0017, considered very significant. There was no significant difference between Bare and AgNP/HC.](/cms/asset/3f8b57ec-e446-4a8b-bad7-fd225b2ee171/ianb_a_1178132_f0003_c.jpg)