
Figures & data
Figure 1. Growth of PPy–DBS films in aqueous solution of 0.15 M pyrrole and 0.2 M DBS at a scan rate of 20 mV/s vs Ag/AgCl electrode (3.0 M KCl).
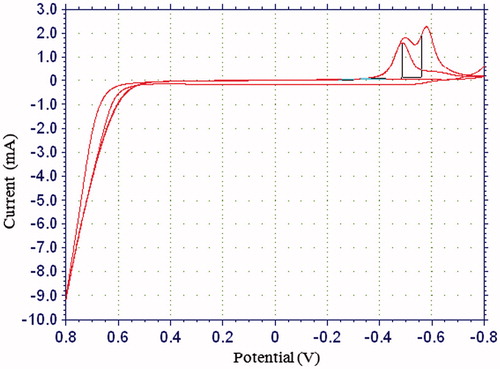
Figure 2. The SEM of Pt/PPy–DBS electrode.
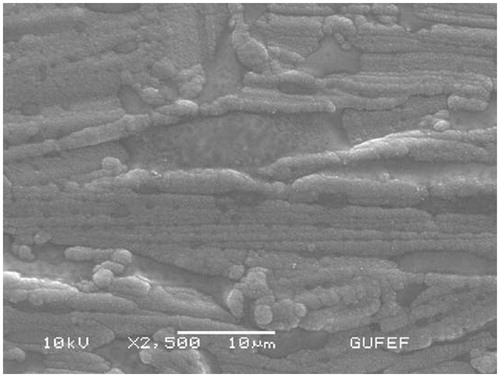
Figure 3. The SEM of Pt/PPy–DBS–ChOx.
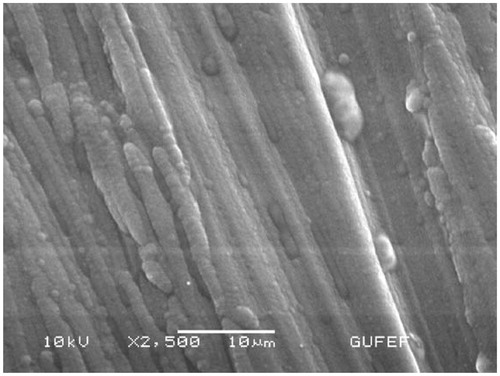
Figure 4. The AFM of Pt/PPy–DBS–ChOx.
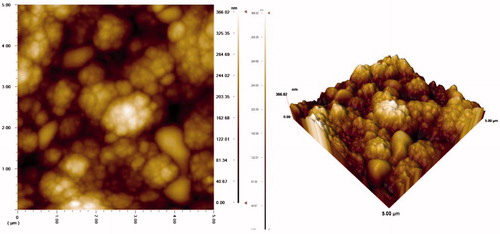
Figure 5. The AFM of Pt/PPy–DBS electrode.
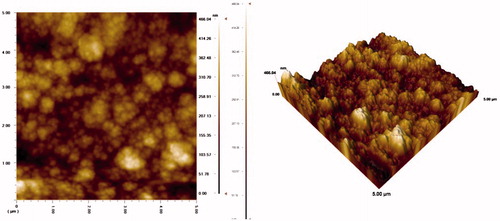
Figure 6. The contact angle of Pt/PPy–DBS electrode.

Figure 7. The contact angle of Pt/PPy–DBS–ChOx.

Figure 8. Amperometric response measurements of Pt/PPy–DBS electrode.
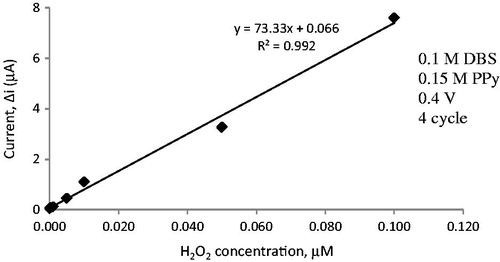
Figure 9. The effects of different potentials on amperometric response measurements.
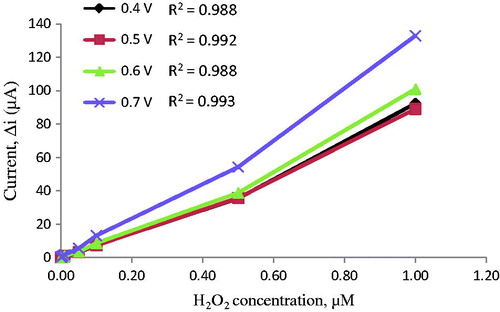
Figure 10. The effects of different pyrrole concentrations on amperometric response measurements.
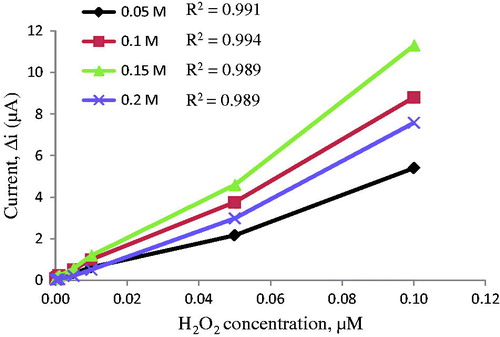
Figure 11. The effects of different concentrations of sodium dodecylbenzene sulphonate on amperometric response measurements.
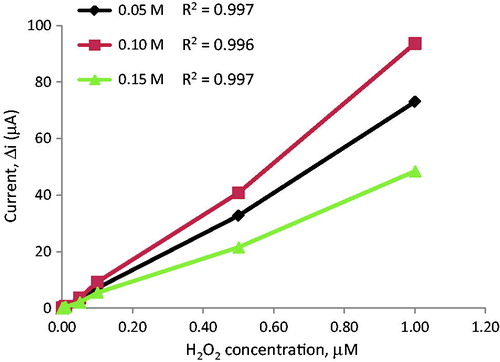
Figure 12. The effects of cycle number of polypyrrole film on amperometric response measurements.
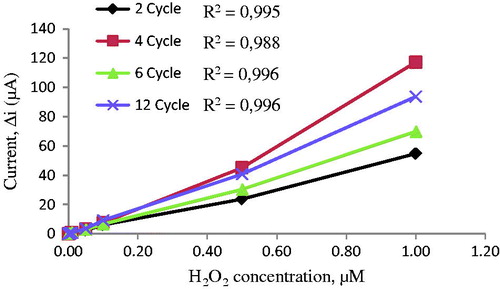
Figure 13. Amperometric response measurements of Pt/PPy–DBS–ChOx electrode.
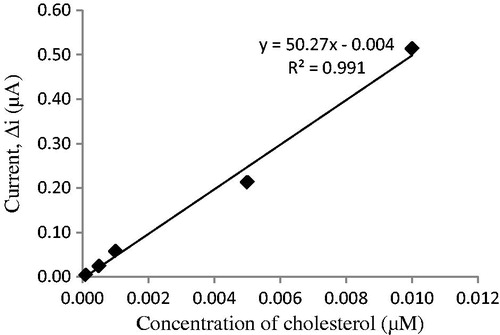
Figure 14. The effect of pH on the response of the biosensor (in the phosphate buffer (pH 7.0) containing 50 μM cholesterol at 0.4 V working potential).
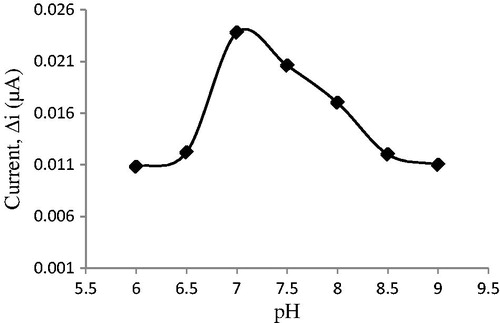
Figure 15. The effect of temperature on the response of the biosensor (at pH 7.0, 50 μM cholesterol at 0.4 V working potential).
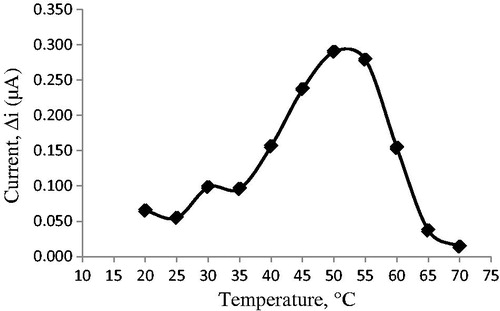
Figure 16. The effect of cholesterol concentration on the response of the biosensor (at 0.1 M pH 7.0 the phosphate buffer, 25 °C, 0.4 V working potential).
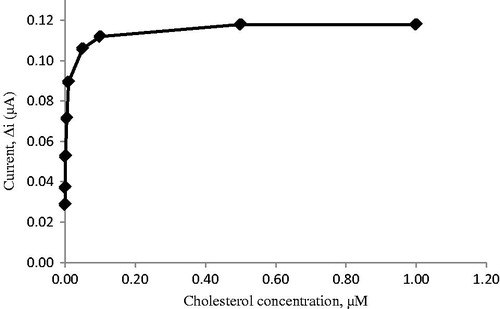
Figure 17. The effect of cholesterol concentration on the response of the biosensor (Lineweaver–Burk plot at 0.1 M pH 7.0 phosphate buffer, 25 °C, 0.4 V working potential).
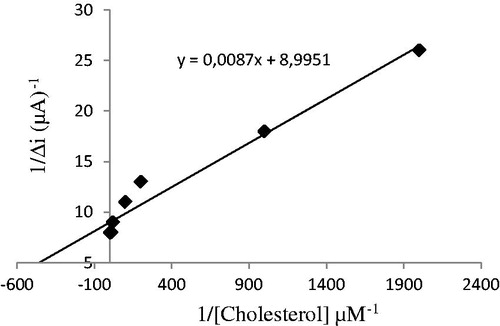
Figure 18. Operational stability of the biosensor in pH 7.0 phosphate buffer, 50 μM cholesterol 25 °C, 0.4 V working potential.
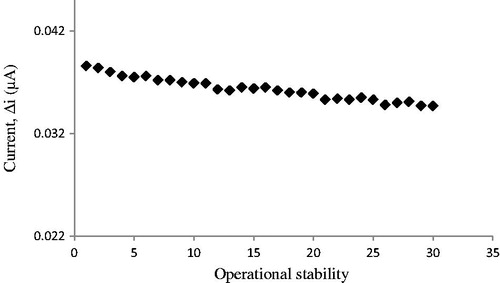
Figure 19. Storage stability of the biosensor in pH 7.0 phosphate buffer, 50 μM cholesterol 25 °C, 0.4 V working potential.
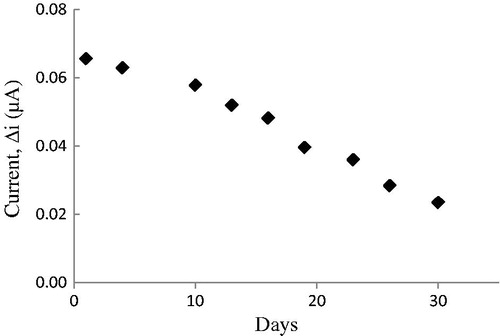
Table 1. Interfering substances on the amperometric response of the biosensor.